
What Are Germany’s Top 10 Imports?
Key Takeaways Germany’s Highest-Value Import Categories Rank Category Import Value (€ billion) 1 Electrical machinery and equipment 194.3 2 Machinery and mechanical appliances 167.8 3 Vehicles other than rail or
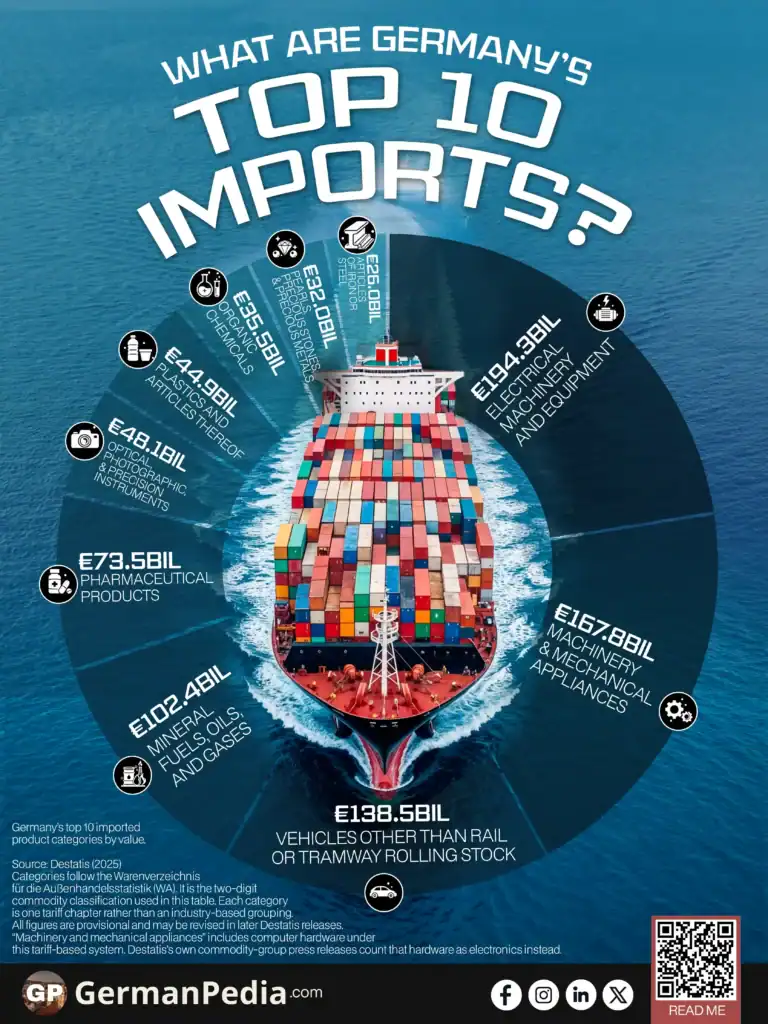
Key Takeaways Germany’s Highest-Value Import Categories Rank Category Import Value (€ billion) 1 Electrical machinery and equipment 194.3 2 Machinery and mechanical appliances 167.8 3 Vehicles other than rail or
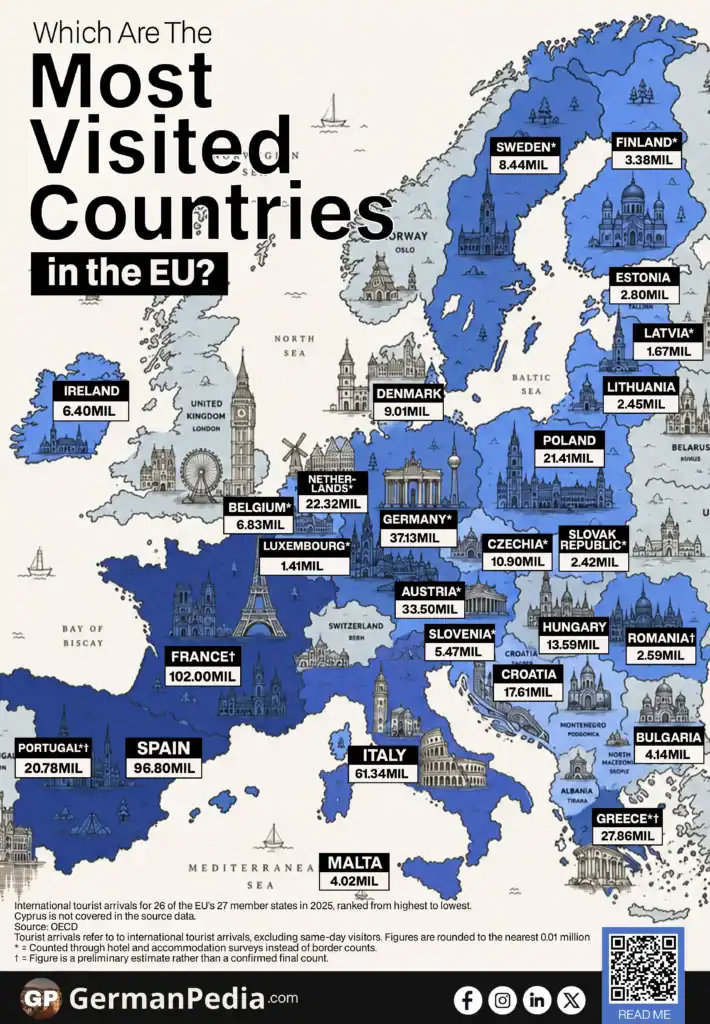
Key Takeaways EU Countries With the Most International Tourist Arrivals Country Arrivals (In millions) France† 102.00 Spain 96.80 Italy 61.34 Germany* 37.13 Austria* 33.50 Greece*† 27.86 Netherlands* 22.32 Poland 21.41

Key Takeaways Alcohol Consumption Across EU Countries Country Alcohol consumption (In litres) 2010 2022 Latvia 9.8 11.9 Spain 9.8 11.8 Austria 12.1 11.6 Czechia 11.4 11.6 Romania 10.0 11.6 Estonia

Key Takeaways EU Countries by Sanitation and Drinking Water Protection Score Global Rank (of 180) Country Sanitation and Drinking Water Protection Score 1 Finland 100.0 1 Germany 100.0 5 Luxembourg

Key Takeaways Flu Vaccination Rate by EU Country for People Aged 65 and Over Country Flu Vaccination Rate Ireland 75.71% Denmark 75.6% Sweden 69.0% Portugal 67.5% Spain 67.0% Netherlands 64.1%

Key Takeaways German Cities With the Highest Crime Rates Rank City Cases Crime Rate (per 100,000 residents) 1 Frankfurt am Main 113,603 15,026 2 Berlin 502,742 13,642 3 Bremen 79,494
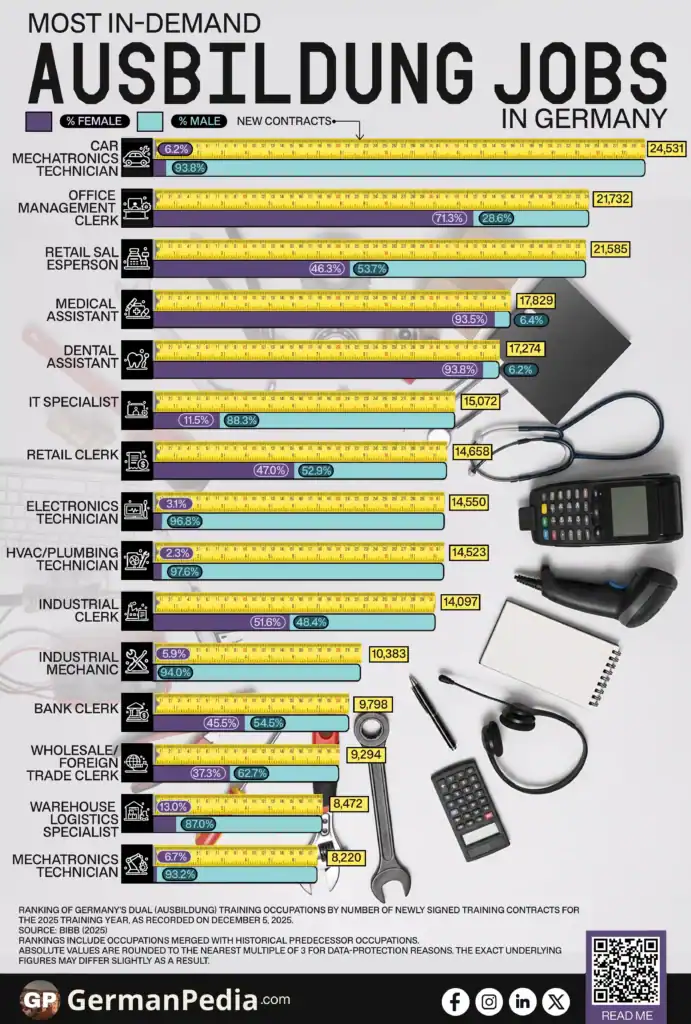
Key Takeaways Top Ausbildung Occupations by New Training Contracts in Germany Rank Occupation New Contracts % Male % Female 1 Kraftfahrzeugmechatroniker/-in (car mechatronics technician) 24,531 93.8% 6.2% 2 Kaufmann/-frau für
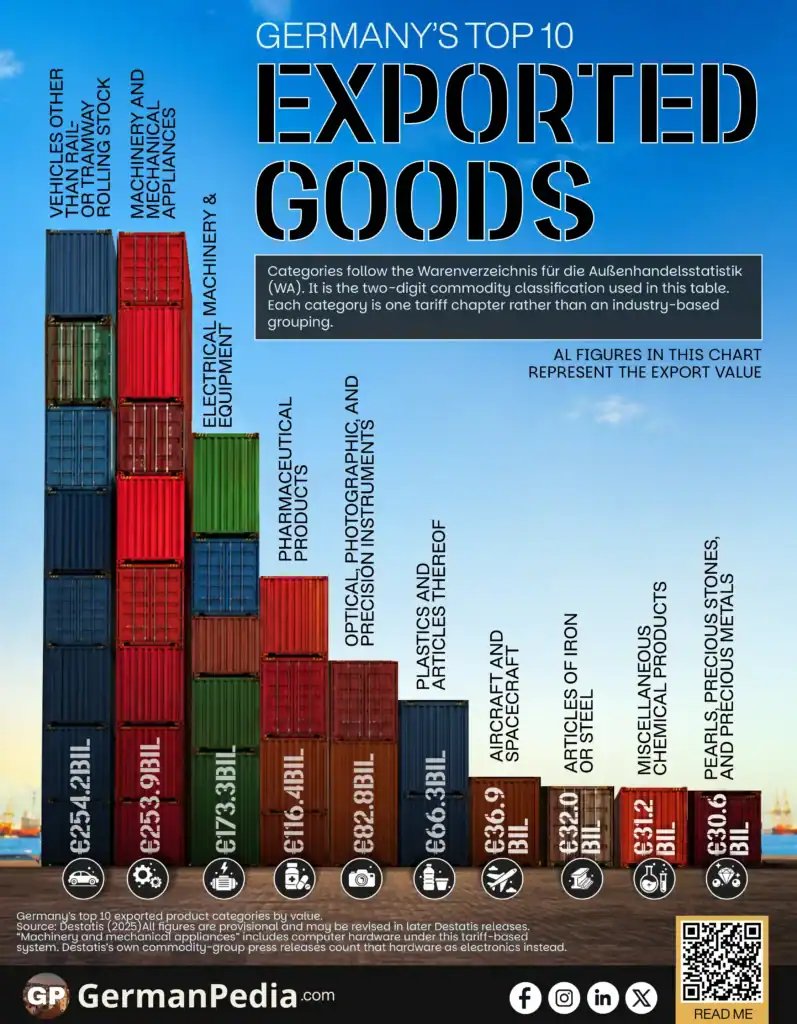
Key Takeaways Germany’s Highest-Value Export Categories Rank Category Export Value (€ billion) 1 Vehicles other than rail- or tramway rolling stock 254.2 2 Machinery and mechanical appliances 253.9 3 Electrical
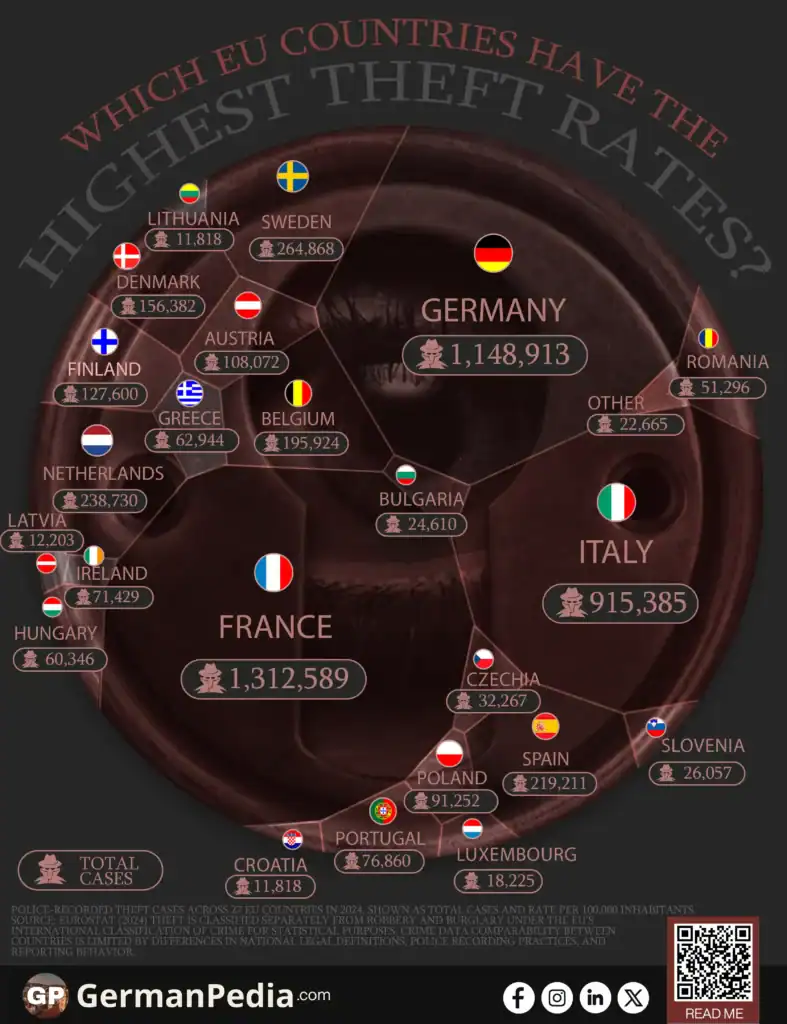
Key Takeaways Cases of Theft by EU Country Country Total Cases Per 100,000 Inhabitants Luxembourg 18,225 2,712 Denmark 156,382 2,623 Sweden 264,868 2,510 Finland 127,600 2,277 France 1,312,589 1,911 Belgium
Key Takeaways EU Countries’ Growth in Defense Spending Country 2014 (USD billions) 2025 (USD billions) Change (in p.p.) Lithuania 0.5 (0.88%) 3.0 (4.03%) +3.15 Latvia 0.3 (0.97%) 1.4 (3.67%) +2.70
You are currently viewing a placeholder content from Vimeo. To access the actual content, click the button below. Please note that doing so will share data with third-party providers.
More InformationYou are currently viewing a placeholder content from YouTube. To access the actual content, click the button below. Please note that doing so will share data with third-party providers.
More InformationYou need to load content from reCAPTCHA to submit the form. Please note that doing so will share data with third-party providers.
More InformationYou are currently viewing a placeholder content from Google Maps. To access the actual content, click the button below. Please note that doing so will share data with third-party providers.
More InformationYou are currently viewing a placeholder content from Google Maps. To access the actual content, click the button below. Please note that doing so will share data with third-party providers.
More InformationYou are currently viewing a placeholder content from Mapbox. To access the actual content, click the button below. Please note that doing so will share data with third-party providers.
More InformationYou are currently viewing a placeholder content from OpenStreetMap. To access the actual content, click the button below. Please note that doing so will share data with third-party providers.
More Information