Key Takeaways
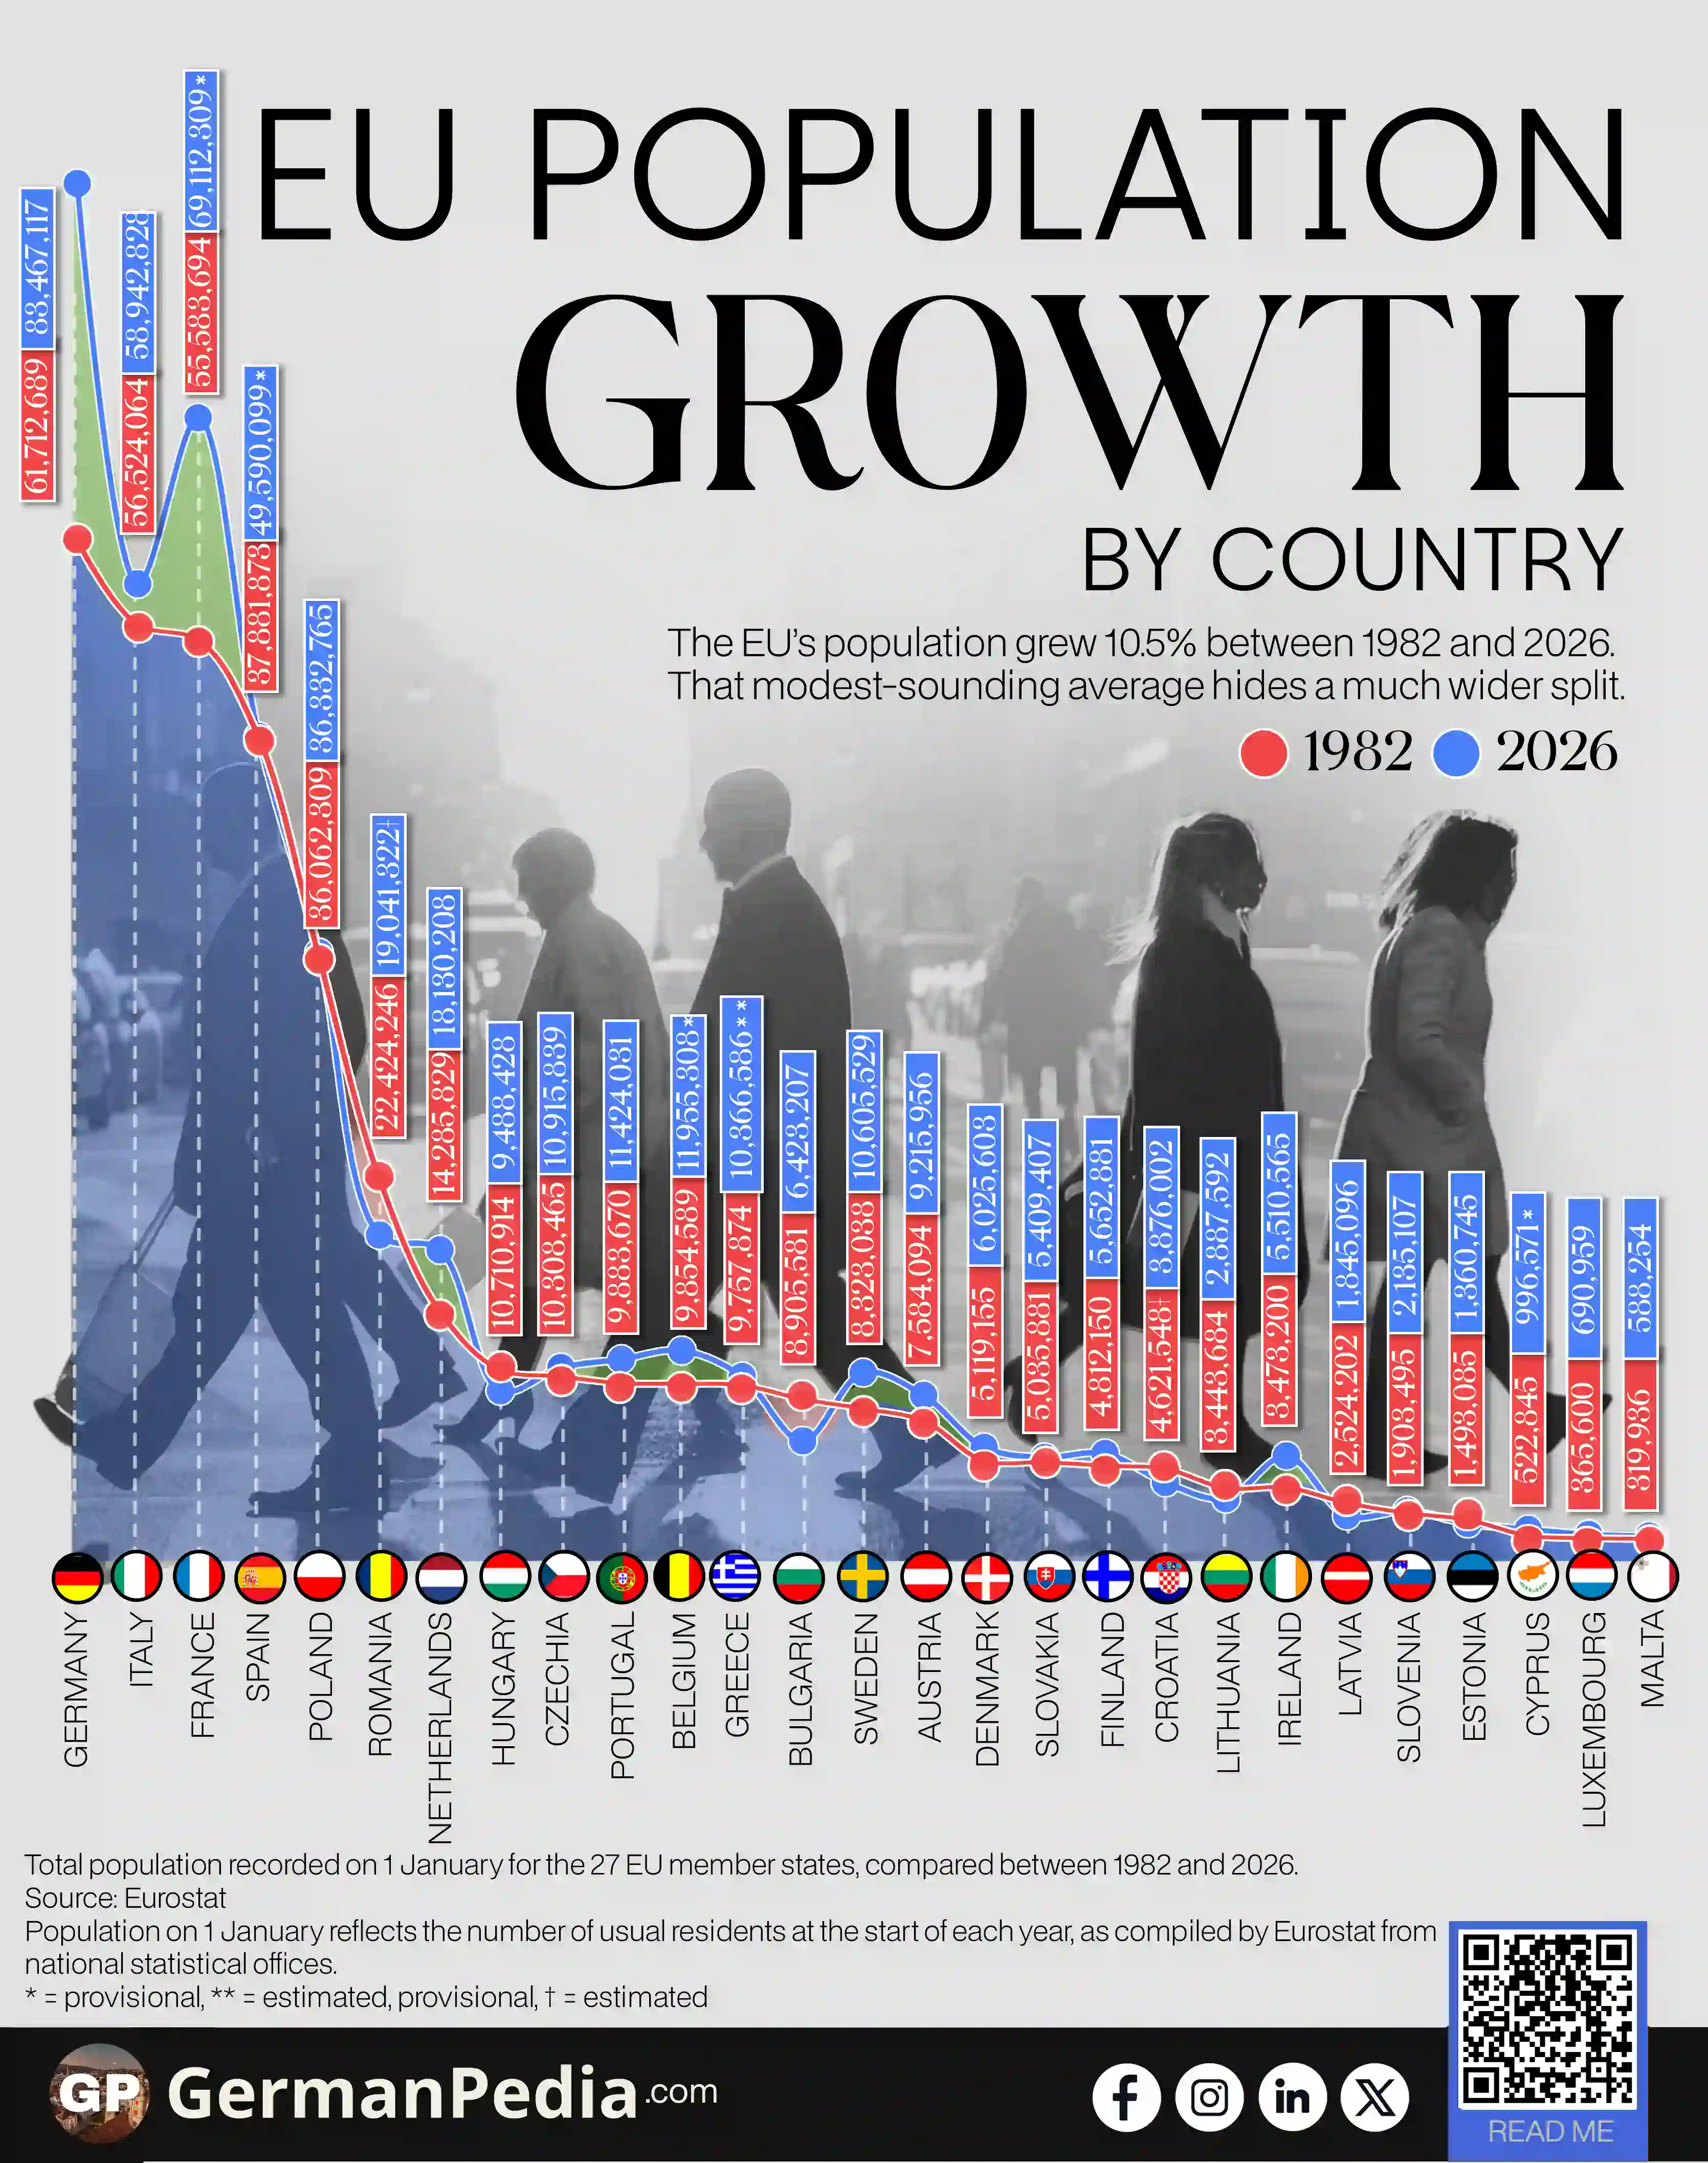
- The EU’s population grew 10.5% between 1982 and 2026. That average hides a huge range, from Cyprus’s +90.6% population growth to Bulgaria’s -27.9% population decline.
- Cyprus, Luxembourg, Malta, and Ireland posted the EU’s fastest population growth since 1982. Immigration, not births, drove most of that increase.
- Germany’s population grew by more people than any other EU country between 1982 and 2026. It gained 21.8 million residents over that period.
- Bulgaria and Latvia posted the EU’s steepest population declines since 1982. Negative natural change drove both declines.
- Croatia, Lithuania, Romania, Hungary, and Estonia’s populations also shrank since 1982. Each lost at least 8.9% of its 1982 population.
- Whether an EU country’s population grows or shrinks now comes down to migration, not birth rates.
- The EU’s natural change turned negative in 2012, when deaths began outnumbering births.
Use this Visualization: You may use this image for free with proper attribution to GermanPedia (i.e., by linking back to GermanPedia).
Need help communicating complex ideas visually? We help you turn data into your most persuasive story. Contact us to learn more.
Population Growth and Decline Across EU Countries
| Country | Population | ||
|---|---|---|---|
| As of 1 Jan 1982 | As of 1 Jan 2026 | Change (%) | |
| Cyprus | 522,845 | 996,571* | +90.6 |
| Luxembourg | 365,600 | 690,959 | +89.0 |
| Malta | 319,936 | 588,254 | +83.9 |
| Ireland | 3,473,200 | 5,510,565 | +58.7 |
| Germany | 61,712,689 | 83,467,117 | +35.3 |
| Spain | 37,881,873 | 49,590,099* | +30.9 |
| Sweden | 8,323,038 | 10,605,529 | +27.4 |
| Netherlands | 14,285,829 | 18,130,208 | +26.9 |
| France | 55,583,694 | 69,112,309* | +24.3 |
| Austria | 7,584,094 | 9,215,956 | +21.5 |
| Belgium | 9,854,589 | 11,955,308* | +21.3 |
| Denmark | 5,119,155 | 6,025,603 | +17.7 |
| Finland | 4,812,150 | 5,652,881 | +17.5 |
| Portugal | 9,883,670 | 11,424,031 | +15.6 |
| Slovenia | 1,903,495 | 2,135,107 | +12.2 |
| Slovakia | 5,035,881 | 5,409,407 | +7.4 |
| Greece | 9,757,874 | 10,366,586** | +6.2 |
| Czechia | 10,308,465 | 10,915,839 | +5.9 |
| Italy | 56,524,064 | 58,942,828 | +4.3 |
| Poland | 36,062,309 | 36,332,765 | +0.7 |
| Estonia | 1,493,085 | 1,360,745 | -8.9 |
| Hungary | 10,710,914 | 9,488,428 | -11.4 |
| Romania | 22,424,246 | 19,041,322† | -15.1 |
| Croatia | 4,621,548† | 3,876,002 | -16.1 |
| Lithuania | 3,443,684 | 2,887,592 | -16.2 |
| Latvia | 2,524,202 | 1,845,096 | -26.9 |
| Bulgaria | 8,905,581 | 6,423,207 | -27.9 |
Source: Eurostat
Population on 1 January reflects the number of usual residents at the start of each year, as compiled by Eurostat from national statistical offices.
* = provisional
** = estimated, provisional
† = estimated
The EU’s population grew 10.5% between 1982 and 2026. That modest-sounding average hides a much wider split.

Cyprus, Luxembourg, Malta, and Ireland Post the EU’s Fastest Population Growth Since 1982
Cyprus recorded the EU’s fastest population growth since 1982. Its population rose 90.6% over that period, from 522,845 to 996,571 people.
Three more EU countries posted growth above 55% over the same 44 years:
- Luxembourg: from 0.4 million to 0.7 million (+89.0% pop. growth)
- Malta: from 0.3 million to 0.6 million (+83.9%)
- Ireland: from 3.5 million to 5.5 million (+58.7%)
Immigration explains most of that growth. Malta, Cyprus, and Luxembourg posted the EU’s highest immigration rates in 2024:
- Malta: 60 immigrants per 1,000 residents
- Cyprus: 42 immigrants per 1,000 residents
- Luxembourg: 38 immigrants per 1,000 residents
Foreign-Born Population in the EU Is Rising ->
Net migration has been the EU’s main driver of population growth since the 1990s. That role grew even more essential after 2012, when deaths began outnumbering births across the EU.
Natural change is a country’s births minus its deaths.
Germany’s Population Grew More Than Any Other EU Country Since 1982
Germany’s population reached about 83.5 million in January 2026. It stood at 61.7 million in 1982.
Population of Cities in Germany [German Population Statistics] ->
Germany’s growth reached 35.3% between 1982 and 2026. That is a gain of around 21.8 million residents. No other EU country added as many people over the same 44-year period.
Migration drove most of Germany’s growth as well, though that momentum has slowed recently.
Germany’s population fell by 110,000 in 2025. That was its first annual decline since 2020.
Net migration fell 45% in 2025. It dropped from 430,000 people in 2024 to 235,000.
The drop came mostly from fewer asylum arrivals from Syria, Turkey, and Afghanistan. Arrivals from Ukraine slowed too.
Deaths also outnumbered births by 352,000 in 2025. Immigration no longer covered that gap.
Bulgaria and Latvia Post the EU’s Steepest Population Declines Since 1982
Bulgaria recorded the EU’s steepest population decline since 1982. Its population fell 27.9% between 1982 and 2026. It dropped from about 8.9 million to 6.4 million people.
Latvia posted the second-steepest population decline. Itspopulation fell 26.9% over the same 44 years.
Latvia’s population dropped from about 2.5 million to 1.8 million people between 1982 and 2026.
Bulgaria and Latvia’s declines trace to negative natural change. Both recorded the EU’s largest negative rates among all 27 countries.
Low fertility, high mortality, and emigration all drive Bulgaria’s population decline.
Latvia recorded about twice as many deaths as births in 2024. More people also left the country than arrived that year.
Five more EU countries also lost population over the same 44 years:
- Lithuania: from 3.4 million to 2.9 million (-16.2% pop. decline)
- Croatia: from 4.6 million to 3.9 million (-16.1%)
- Romania: from 22.4 million to 19.0 million (-15.1%)
- Hungary: from 10.7 million to 9.5 million (-11.4%)
- Estonia: from 1.5 million to 1.4 million (-8.9%)
Lithuania, Hungary, and Romania also recorded negative natural change in 2025 that migration didn’t offset.
Migration, not birth rates, now decides whether an EU country’s population rises or falls. That split explains both ends of the EU’s population range, from Cyprus’s growth to Bulgaria’s decline.
More topics
- Largest Cities in the EU by Population
- EU’s Senior Population is Growing
- Indian Population in Berlin, Ranked by District
- Largest Foreign Nationalities in Berlin
- Which EU Countries Have the Highest English Proficiency?
- German Cities with the Highest Crime Rates
- Which Are the Busiest Airports in the EU by Passengers?
- Germany’s Top 10 Exported Goods
- EU Countries Gaining and Losing the Most Tourists
- Which EU Countries Export the Most Food?
- EU Relies on Imports for Natural Gas
- EU Household Expenditure on Food and Non-Alcoholic Beverages
- EU Countries Are Only Partly Self-Sufficient in Food
- Leading EU Exporters and Importers of Digitally Delivered Services
- US Oil Exports to the EU Are Highly Concentrated
References
- https://ec.europa.eu/eurostat/databrowser/view/DEMO_GIND__custom_22517936/default/table
- https://ec.europa.eu/eurostat/statistics-explained/index.php?title=Population_and_population_change_statistics
- https://ec.europa.eu/eurostat/statistics-explained/index.php?title=Migration_to_and_from_the_EU
- https://www.destatis.de/DE/Presse/Pressemitteilungen/2026/06/PD26_184_12411.html
- https://www.destatis.de/DE/Presse/Pressemitteilungen/2026/06/PD26_203_124.html
- https://www.bnb.bg/bnbweb/groups/public/documents/bnb_publication/pub_topresandhigh_2022_02_en.pdf
- https://stat.gov.lv/en/statistics-themes/population/population/press-releases/22900-number-population-latvia-2024