Key Takeaways
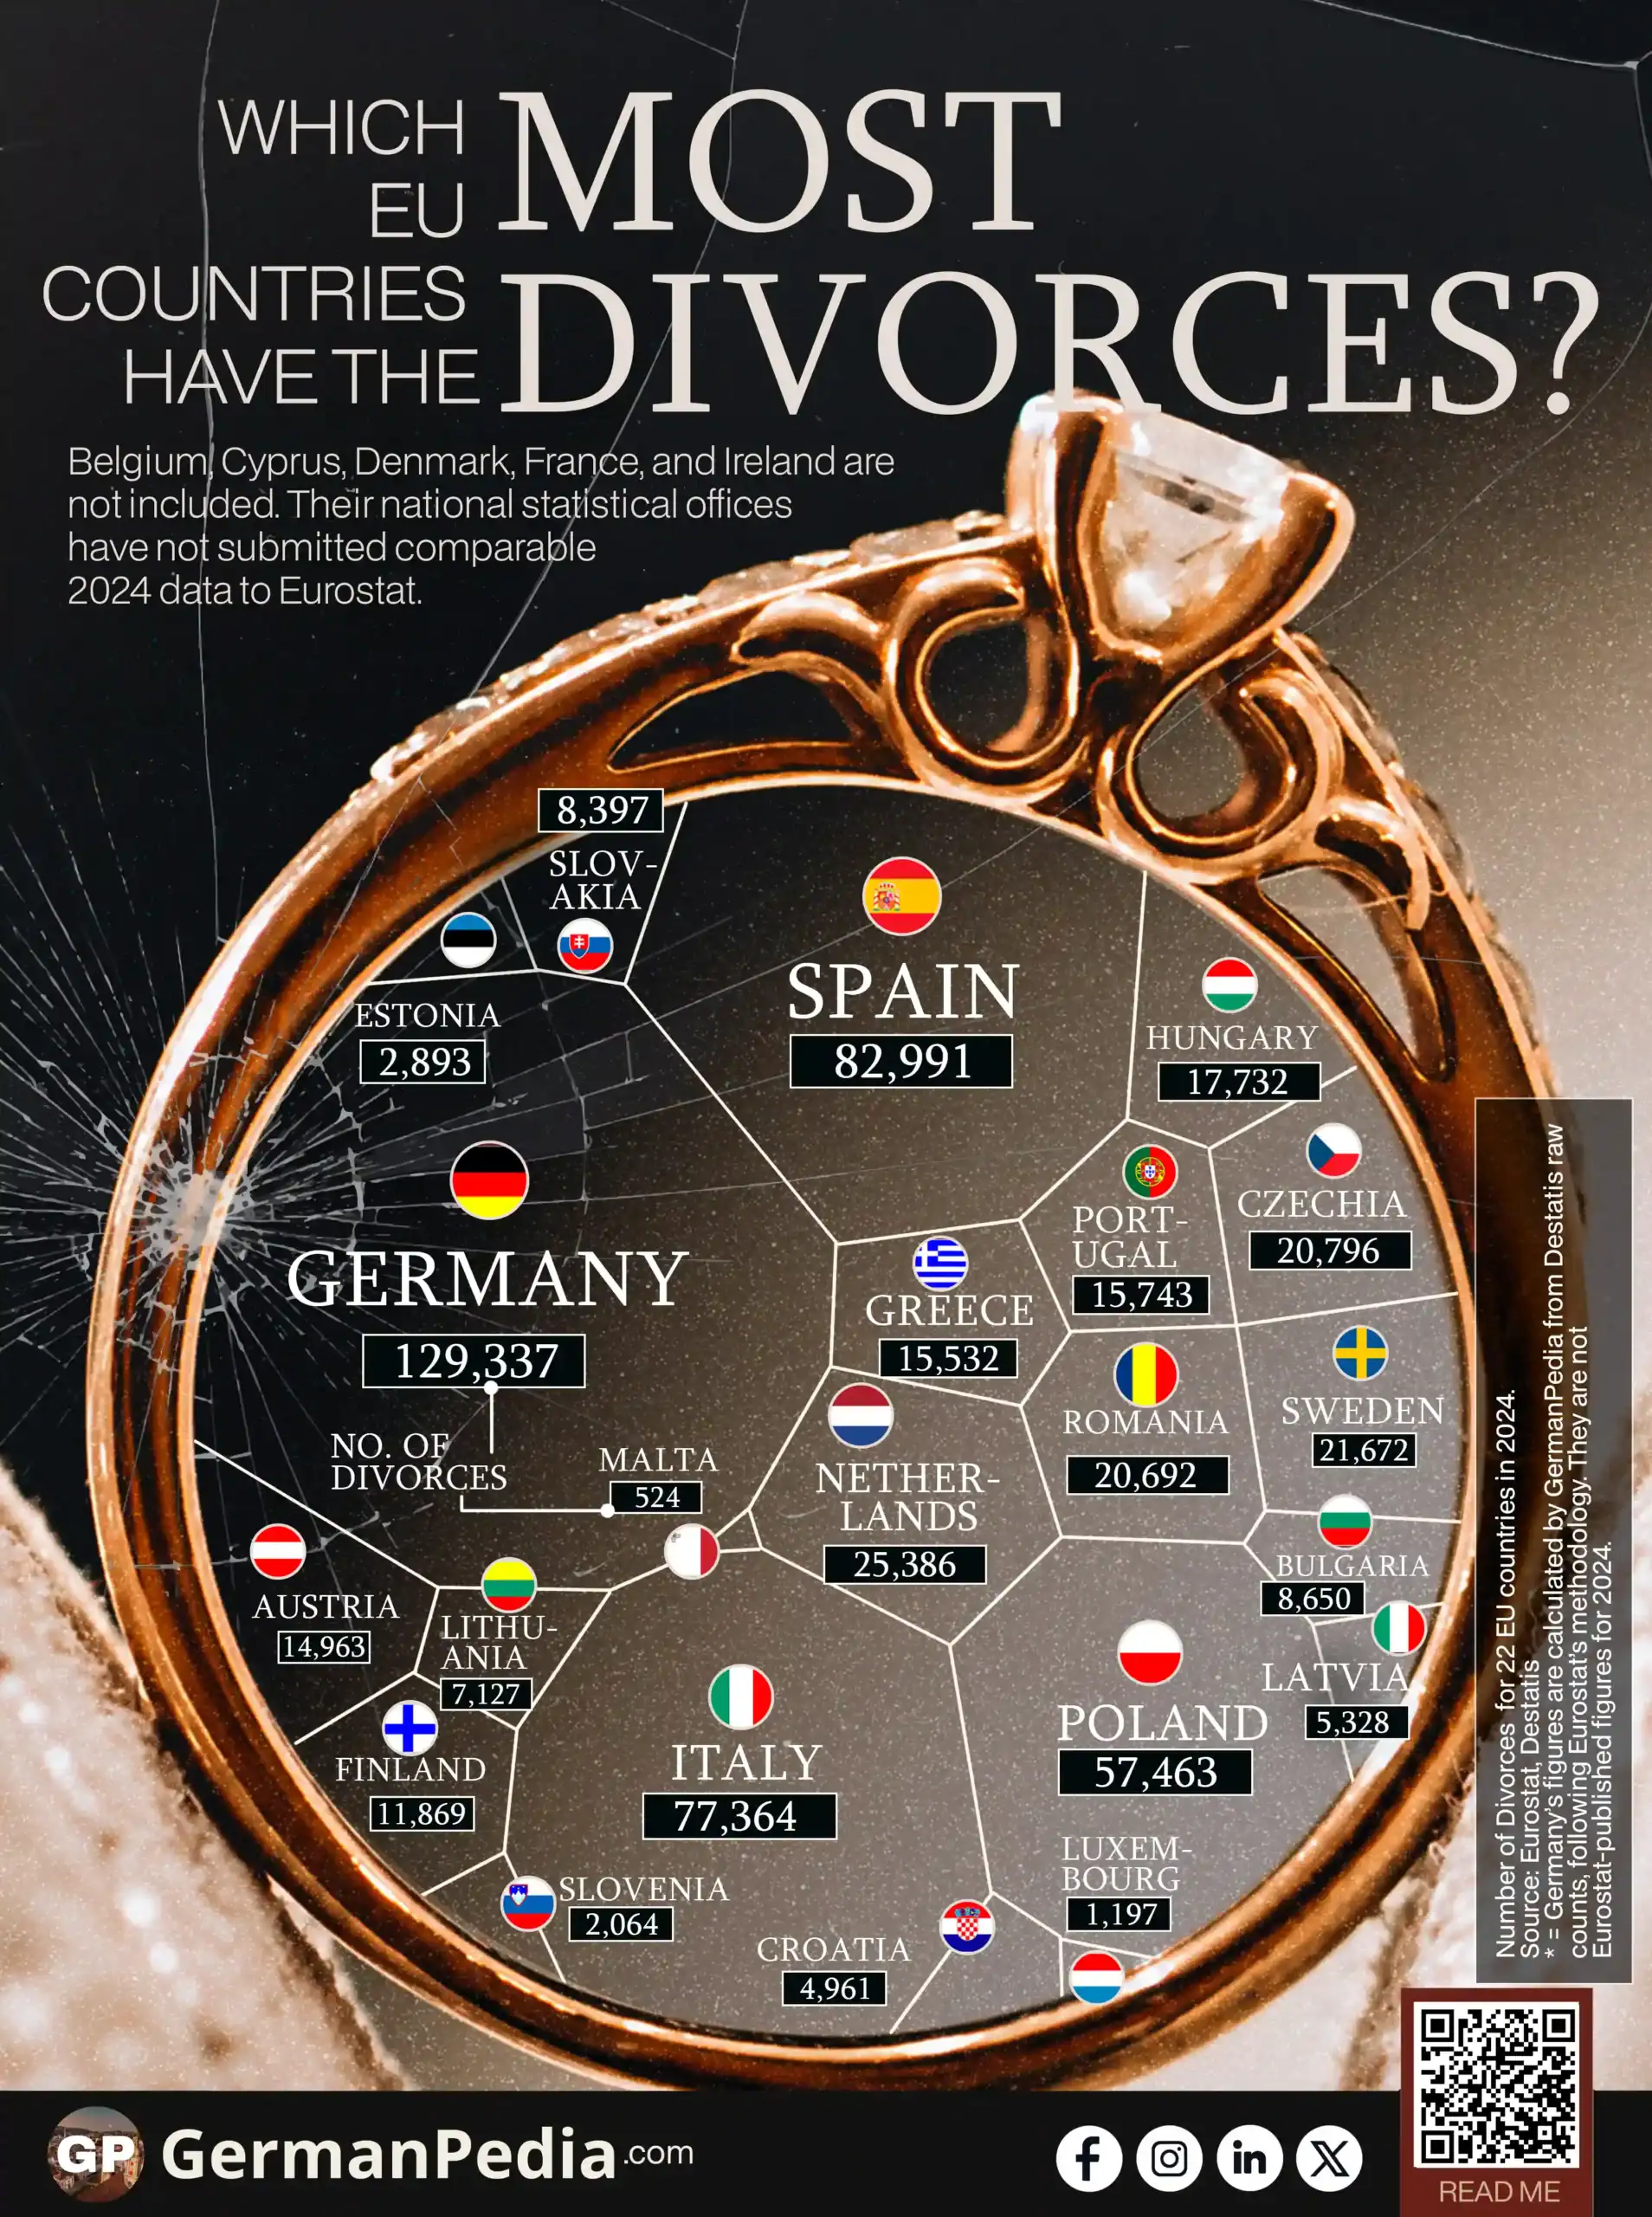
- Germany recorded the most divorces of any country in this table. Its total reached 129,337 in 2024.
- Germany’s divorce rate reached only 1.5 per 1,000 people in 2024. That ranks in the lower half of the countries in this table.
- Latvia and Lithuania have the highest divorce rates in this table. Their rates reached 2.8 and 2.5 per 1,000 people in 2024.
- Malta and Slovenia have the lowest divorce rates in this table. Malta’s is 0.9 per 1,000 people, and Slovenia’s is 1.0.
- Higher divorce rates in the Baltics and Nordic countries trace to earlier divorce-law reform and more women working and completing higher education. Malta’s low rate reflects its recent legalization of divorce in 2011.
Use this Visualization: You may use this image for free with proper attribution to GermanPedia (i.e., by linking back to GermanPedia).
Need help communicating complex ideas visually? We help you turn data into your most persuasive story. Contact us to learn more.
Divorces and Divorce Rates by EU Country
| Country | Divorces | Divorce Rate (per 1,000 people) |
|---|---|---|
| Germany* | 129,337 | 1.5 |
| Spain | 82,991 | 1.7 |
| Italy | 77,364 | 1.3 |
| Poland | 57,463 | 1.6 |
| Netherlands | 25,386 | 1.4 |
| Sweden | 21,672 | 2.1 |
| Czechia | 20,796 | 1.9 |
| Romania | 20,692 | 1.1e |
| Hungary | 17,732 | 1.9 |
| Portugal | 15,743 | 1.5 |
| Greece | 15,532 | 1.5 |
| Austria | 14,963 | 1.6 |
| Finland | 11,869 | 2.1 |
| Bulgaria | 8,650 | 1.3 |
| Slovakia | 8,397 | 1.5 |
| Lithuania | 7,127 | 2.5 |
| Latvia | 5,328 | 2.8 |
| Croatia | 4,961 | 1.3 |
| Estonia | 2,893 | 2.1 |
| Slovenia | 2,064 | 1.0 |
| Luxembourg | 1,197 | 1.8 |
| Malta | 524 | 0.9 |
Source: Eurostat, Destatis
Divorce rate is the number of divorces in a year for every 1,000 people in the population. It uses the average of the population on 1 January of that year and 1 January of the following year. Belgium, Cyprus, Denmark, France, and Ireland are not included. Their national statistical offices have not submitted comparable 2024 data to Eurostat.
e = estimated by Eurostat
* = Germany’s figures are calculated by GermanPedia from Destatis raw counts, following Eurostat’s methodology. They are not Eurostat-published figures for 2024.

Germany recorded 129,337 divorces in 2024. It is the highest number in this table. However, a country’s raw divorce count is often just a reflection of population and marriage volume. It does not measure how common divorce actually is relative to how many people live there.
Divorce Statistics in Germany ->
The clearer measure is the divorce rate. It counts divorces per 1,000 people in a country each year. That puts every country on the same scale.
A related but different measure, divorces per 100 marriages, compares divorces only to marriages from the same year rather than to the whole population. By that measure, Germany’s figure is 37.0%.
Germany’s divorce rate reached 1.5 per 1,000 people in 2024. Three countries share that exact rate:
- Portugal
- Greece
- Slovakia
Each of them has far fewer people and far fewer divorces than Germany. Having more divorces does not mean a higher divorce rate.
Latvia and Lithuania Have the Highest Divorce Rates in the EU
Latvia and Lithuania record the highest divorce rates among 22 EU countries:
- Latvia: 2.8 per 1,000 people
- Lithuania: 2.5 per 1,000 people
Estonia, Finland, and Sweden follow closely, tied at 2.1. All five are Baltic or Nordic countries.
Two factors help explain this pattern:
- Countries with more women working and completing higher education tend to have higher divorce rates across the OECD.
- Countries where divorce became legal, or easier to obtain, earlier than others have had more time for their divorce rates to reach today’s higher levels.
Malta Has the Lowest Divorce Rate Among 22 EU Countries
Malta’s divorce rate is 0.9 per 1,000 people. That is the lowest among 22 EU countries. Slovenia is close behind at 1.0.
Malta only made divorce legal in 2011. A national vote led to the change. The original law required couples to live apart for four years before they could divorce. A 2021 law shortened that wait to six months if both spouses agreed, or one year if only one spouse wanted the divorce. Malta’s low divorce rate still reflects the decades when divorce was not legally possible at all.
Romania’s divorce rate is 1.1. That is the third-lowest among 22 EU countries. Eurostat marks this figure as an estimate.
Czechia’s Divorce Rate Is Higher Than Poland’s Despite Far Fewer Divorces
Poland recorded 57,463 divorces in 2024. That is the fourth-highest total among 22 EU countries. Its divorce rate was 1.6 per 1,000 people.
Czechia recorded 20,796 divorces that year. That is little more than a third of Poland’s total. Its divorce rate still reached 1.9. That is higher than Poland’s.
This table’s pattern repeats an earlier lesson. A country’s raw divorce count depends mostly on its size. Its divorce rate depends only on how many divorces happen for every 1,000 people who live there.
That pattern does not mean divorce is rare in Germany or common in Latvia. It means a single number does not tell the full story on its own. The count shows how many marriages ended in a year. The divorce rate shows how that number compares to the size of the population.
More topics
- Fewer Germans Are Getting Divorced
- Germany’s Marriage Rate Has Fallen to a Record Low
- At What Age Do Germans Marry?
- Where Do Immigrants in Germany Come From?
- Which Countries Do Foreigners in Germany Come From?
- How many Foreign National Prisoners are in the EU?
- Which EU Countries Attract the Most Foreign Investment?
- Energy Consumption for Cooling Has Doubled in the EU
- Which Country Owns Almost a Quarter of the EU’s Wealth?
- Broadband Prices in the EU Over Time
- Bulgaria Now Has the EU’s Highest Smoking Rate
- How much parental leave do you get in the EU?
- Most Popular Degree Programs in Germany
- Which are the toughest prisons in the EU?
- Which EU Country Recycles the Most?
References
- https://ec.europa.eu/eurostat/databrowser/view/demo_ndivind__custom_22239782/default/table
- https://ec.europa.eu/eurostat/cache/metadata/en/demo_nup_esms.htm
- https://www.destatis.de/EN/Themes/Society-Environment/Population/Marriages-Divorces-Life-Partnerships/Tables/divorces-by-type-of-couple.html
- https://www.destatis.de/EN/Themes/Society-Environment/Population/Marriages-Divorces-Life-Partnerships/Tables/marriages-average-age-marriage.html
- https://genesis.destatis.de/datenbank/online/statistic/12411/table/12411-0001
- https://webfs.oecd.org/els-com/Family_Database/SF_3_1_Marriage_and_divorce_rates.pdf
- https://legislation.mt/eli/act/2011/14/eng
- https://legislation.mt/eli/act/2021/25/eng