Key Takeaways
- EU household energy used for air conditioning and other cooling equipment rose 99% between 2018 and 2024. Consumption climbed from 40,508 terajoules to 80,409 terajoules over that period.
- Austria recorded the EU’s fastest percentage growth in cooling energy use. It is up by over 1,000% between 2018 and 2024. Its total volume remains far below southern Europe’s despite the surge.
- Italy added more cooling energy than any other EU country. It rose by 17,305 terajoules between 2018 and 2024. This makes Italy the largest driver of the EU’s total increase.
- Seven EU countries reported no measurable air conditioning energy use in 2018 or 2024. These countries are Denmark, Estonia, Ireland, Latvia, Lithuania, Poland, and Sweden.
- Croatia’s and Romania’s cooling degree days more than doubled between 2018 and 2024, yet their cooling energy use grew by only 4% and 9%.
- A measure of how much heat drives cooling demand rose 47% across the EU between 2018 and 2024. Rising heat exposure is a key driver behind the growth in air conditioning energy use.
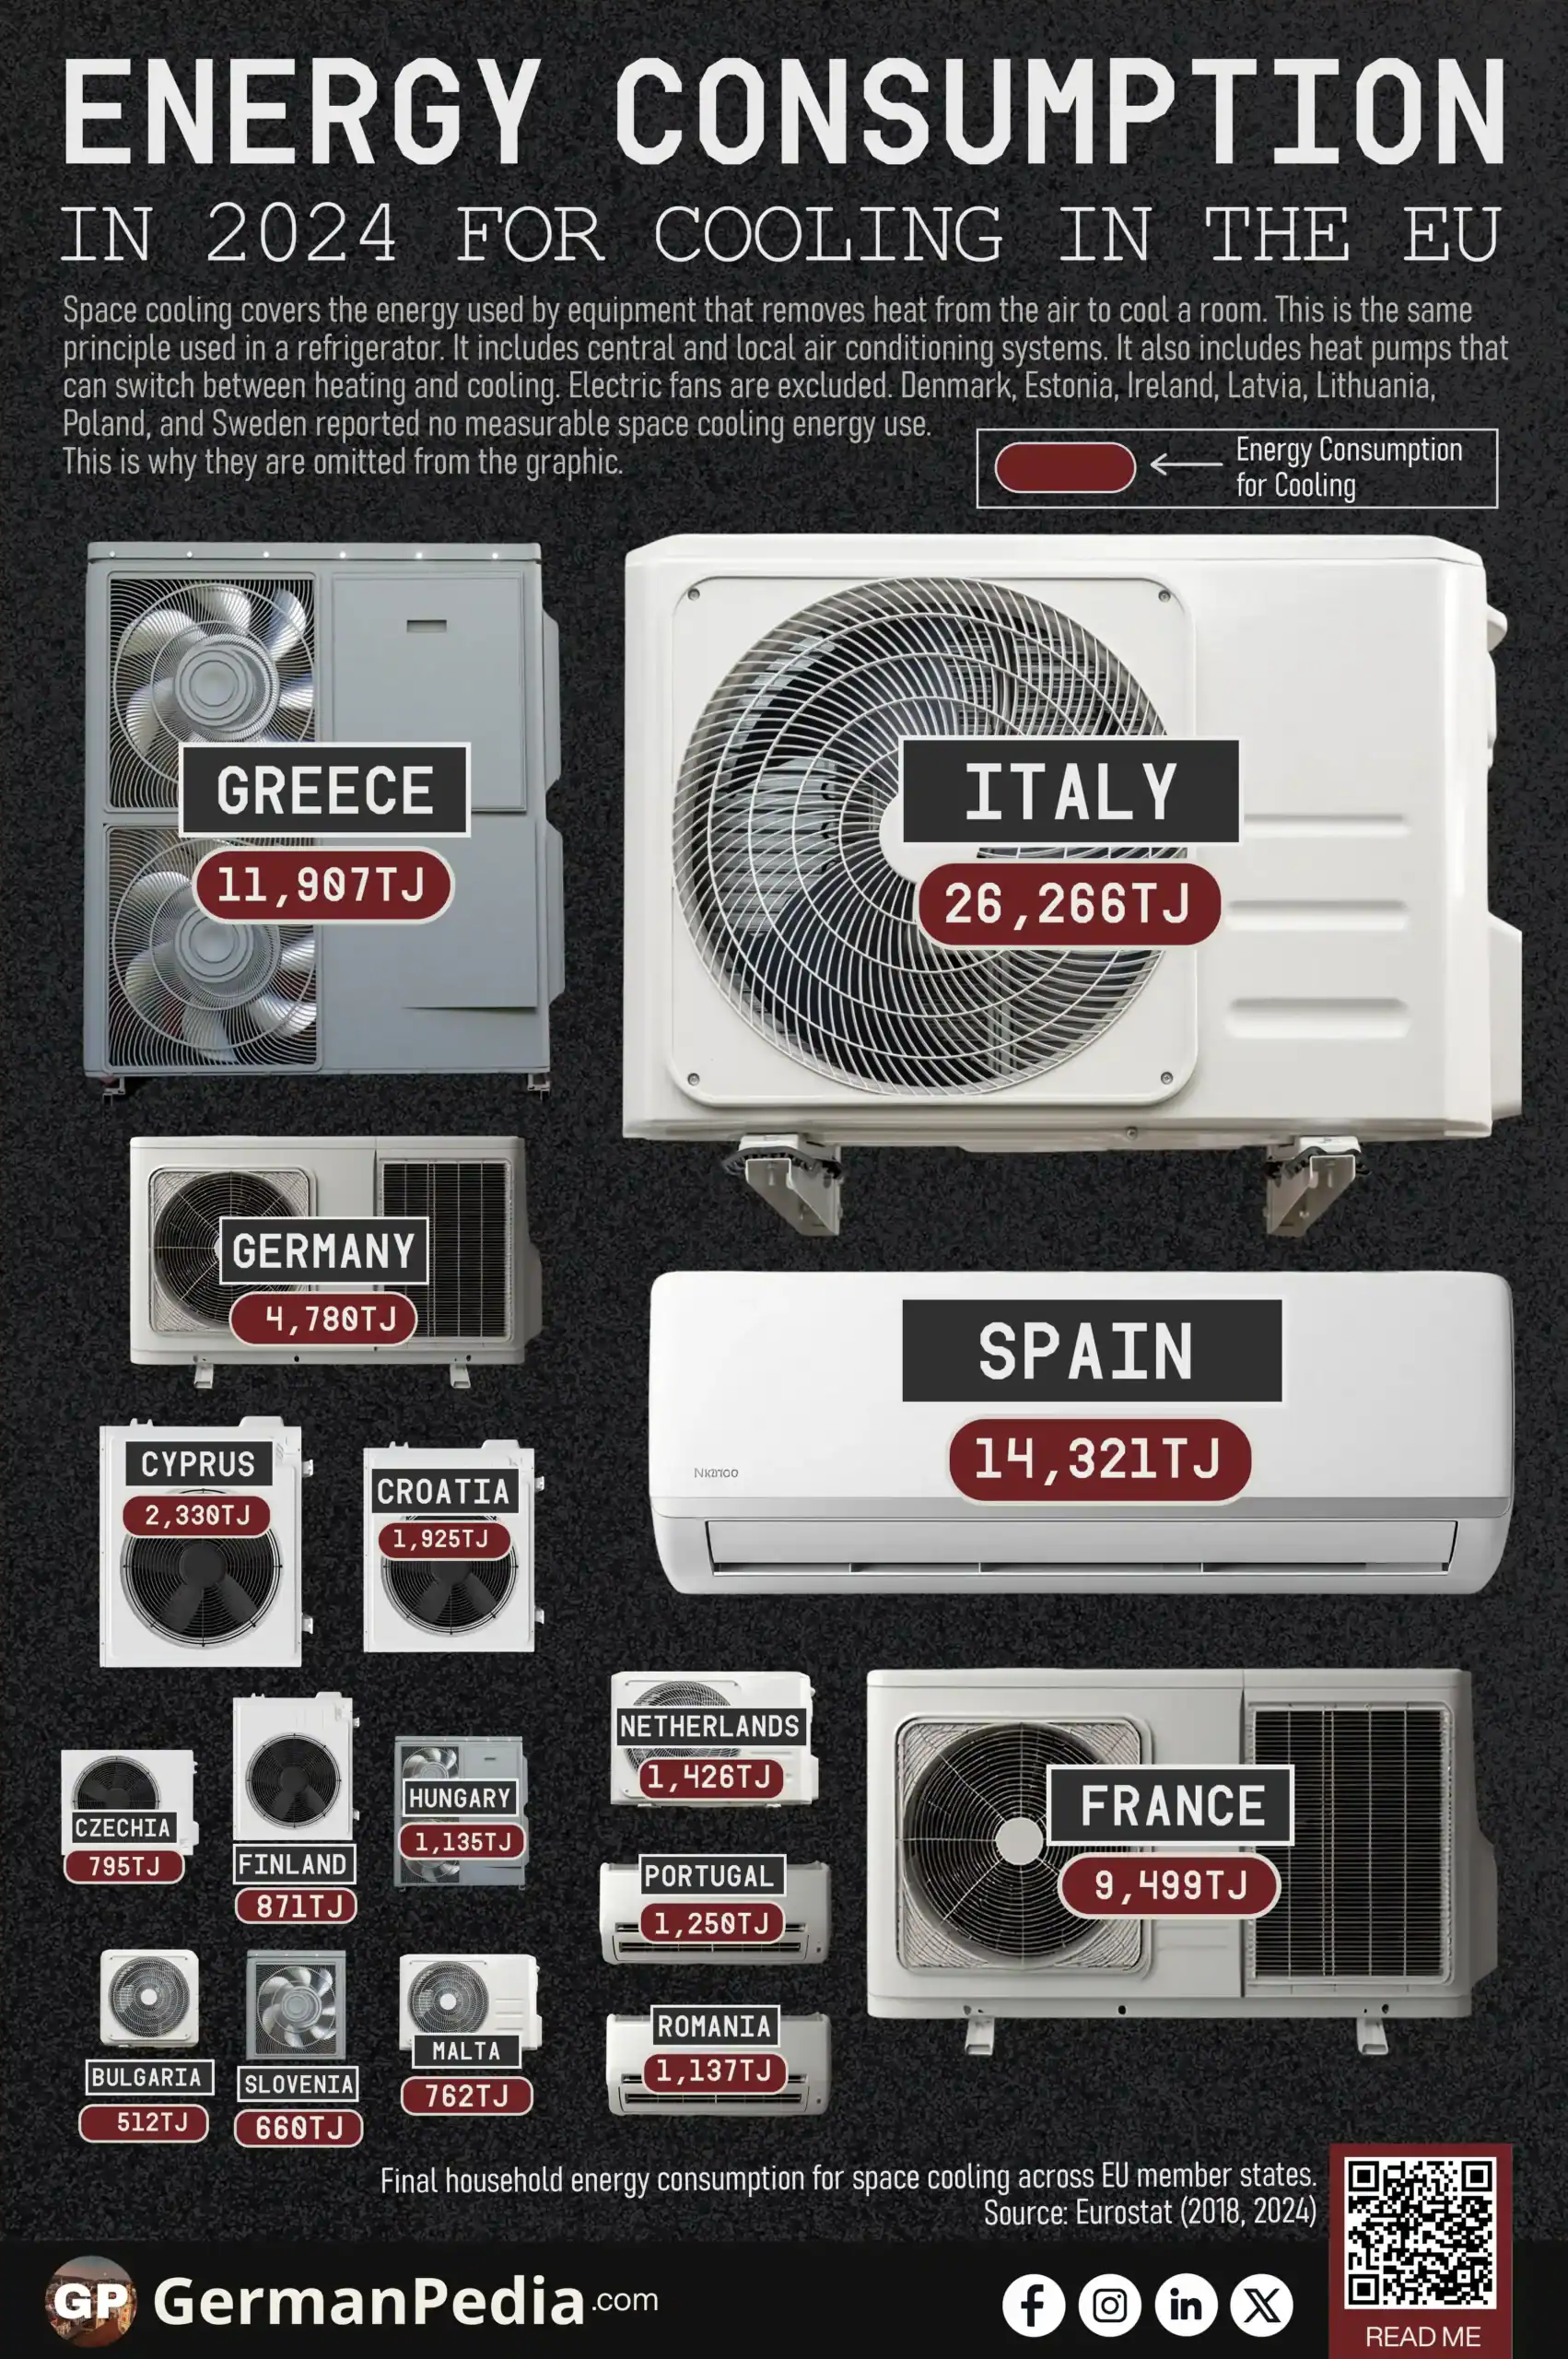
Use this Visualization: You may use this image for free with proper attribution to GermanPedia (i.e., by linking back to GermanPedia).
Need help communicating complex ideas visually? We help you turn data into your most persuasive story. Contact us to learn more.
Change in Air Conditioning Energy Use Across EU Countries
| Country | Energy Consumption for Cooling | ||
|---|---|---|---|
| 2018 (In TJ) | 2024 (In TJ) | Change (In %) | |
| European Union (27 countries) | 40,508 | 80,409 | +99% |
| Austria | 22 | 253 | +1,047% |
| Czechia | 231 | 795 | +244% |
| Italy | 8,960 | 26,266 | +193% |
| Hungary | 419 | 1,135 | +171% |
| Finland | 331 | 871 | +163% |
| Spain | 6,303 | 14,321 | +127% |
| Slovenia | 309 | 660 | +114% |
| Greece | 5,856 | 11,907 | +103% |
| Malta | 440 | 762 | +73% |
| Netherlands | 843 | 1,426 | +69% |
| Portugal | 760 | 1,250 | +64% |
| Belgium | 251 | 386 | +54% |
| France | 6,248 | 9,499 | +52% |
| Cyprus | 1,576 | 2,330 | +48% |
| Bulgaria | 395 | 512 | +30% |
| Luxembourg | 80 | 101 | +26% |
| Romania | 1,045 | 1,137 | +9% |
| Germany | 4,445 | 4,780 | +8% |
| Croatia | 1,859 | 1,925 | +4% |
| Slovakia | 134 | 95 | -29% |
Source: Eurostat (2018, 2024)
Space cooling covers the energy used by equipment that removes heat from the air to cool a room. This is the same principle used in a refrigerator. It includes central and local air conditioning systems. It also includes heat pumps that can switch between heating and cooling. Electric fans are excluded and counted separately under lighting and electrical appliances.
Denmark, Estonia, Ireland, Latvia, Lithuania, Poland, and Sweden reported no measurable space cooling energy use in either year. They are omitted from the table above.

A terajoule is a huge unit of energy. A typical EU household uses between 2,500 and 5,000 kWh of electricity a year. One terajoule equals roughly what 74 such households use in a year. That scale helps explain what is happening across Europe’s homes. EU households used 40,508 terajoules of energy on air conditioning and other cooling equipment in 2018. By 2024, that figure had reached 80,409 terajoules.
Cooling energy use rose 99% over those six years. This growth reflects air conditioning and other cooling equipment specifically. Electric fans are tracked separately, so they play no part in this trend.
Italy Drives the Biggest Absolute Increase in EU Cooling Energy
Italy added 17,305 terajoules of cooling energy use between 2018 and 2024. This is the largest absolute increase of any EU country. Italy’s cooling energy use rose 193% between 2018 and 2024. It climbed from 8,960 terajoules to 26,266 terajoules.
Spain and Greece added the next largest volumes:
- Spain: 6,303 to 14,321 TJ (+127%)
- Greece: 5,856 to 11,907 TJ (+103%)
- France: 6,248 to 9,499 TJ (+52%)
Italy, Spain, Greece, and France together account for 77% of the EU’s total cooling energy use in 2024. Larger, more populous countries use more total energy for any purpose. That is part of why these four countries rank highest in absolute terms.
Austria and Czechia posted the fastest percentage growth in the EU. They recorded over 1,000% and 244%. Both countries started from a small base under 250 terajoules, so their volumes stay far below what southern Europe now uses.
Rising Heat Exposure Is Driving the Growth in Cooling Energy Use
Cooling degree days measure how hot a year was, in a way that matters for cooling demand. Any day averaging 24°C or higher adds to the yearly total. Hotter days add more. Cooler days add nothing. A hot summer produces a high yearly total. A mild summer produces a low one.
The EU’s cooling degree days rose 47% between 2018 and 2024. Cooling energy use rose 99%. The two trends move in the same direction.
The same link shows up within individual countries. Germany’s cooling degree days fell 63% between 2018 and 2024. Germany’s cooling energy use grew by only 8%. It reached 4,780 terajoules in 2024. Less heat limited how much extra cooling energy was needed.
Croatia and Romania break the pattern. Croatia’s cooling degree days rose 114%. Its cooling energy use rose only 4%. Romania’s cooling degree days rose 210%. Its cooling energy use rose only 9%. Rising heat has not translated into matching cooling energy growth in either country. Available data does not explain why.
EU household air conditioner ownership rose from under 7 million units in 1990 to 57 million in 2020. It should exceed 100 million by 2030.
Northern and Eastern Europe Still Barely Uses Air Conditioning
Seven EU countries reported no measurable air conditioning energy use in 2018 or 2024: Denmark, Estonia, Ireland, Latvia, Lithuania, Poland and Sweden. These countries sit in the EU’s coolest climates, where cooling degree days stayed near zero throughout the period.
Slovakia is the only EU country where cooling energy use fell, dropping 29% from 134 to 95 terajoules.
Air conditioning is spreading beyond the EU’s hottest countries. Growth is fastest in places that historically needed it least. Rising heat exposure across the continent is a key driver behind that shift.
More topics
- GDP per Capita vs Actual Consumption per Capita in the EU
- EU Household Expenditure on Food and Non-Alcoholic Beverages
- EU Rent Price Index by Country Over Time
- Apartment Rents Are Rising Faster Than House Rents in Germany
- Grocery Prices in Germany [2000 – 2025]
- Which EU Countries Had the Highest Inflation Rates?
- EU Fertility Rate by Country
- Average Working Hours in EU Countries
- Gender Pay Gap Across EU Countries
- Minimum Wages Rose Fastest in Eastern Europe
- Which EU Countries Have the Highest Unemployment?
- The Best EU Countries to Retire In
- Which EU Country Uses the Most Electricity?
- Most Prosperous EU Countries by Prosperity Index
- Where are Billionaires Concentrated in the EU?
References
- https://ec.europa.eu/eurostat/databrowser/product/view/nrg_d_hhqhttps://ec.europa.eu/eurostat/databrowser/view/nrg_chdd_a/default/table
- https://ec.europa.eu/eurostat/documents/3859598/5935825/KS-GQ-13-003-EN.PDF/baa96509-3f4b-4c7a-94dd-feb1a31c7291
- https://energy-efficient-products.ec.europa.eu/product-list/air-conditioners-and-comfort-fans_en
- https://ec.europa.eu/eurostat/statistics-explained/index.php?title=Electricity_price_statistics