Key Takeaways
- The Netherlands holds 20 of the EU’s 30 greenest cities. Utrechtse Heuvelrug leads with a Green Index of 86.
- None of the Netherlands’ largest cities rank among the EU’s 30 greenest cities. The highest-ranking Dutch geographic cluster instead surrounds the Veluwe forest and the wooded Gooi region.
- Four German cities rank among the EU’s 30 greenest cities. All four cities lost green space between 2022 and 2023.
- Between 2022 and 2023, eleven of the twenty Dutch cities among the EU’s 30 greenest cities gained green space.
- Vilnius is the only national capital among the EU’s 30 greenest cities. Its green-space share of 61% is the highest of any European capital tracked.
- Land explains the highest Green Index among the Dutch towns near the Veluwe and the Gooi. Their borders run into existing forest, which counts double toward the score.
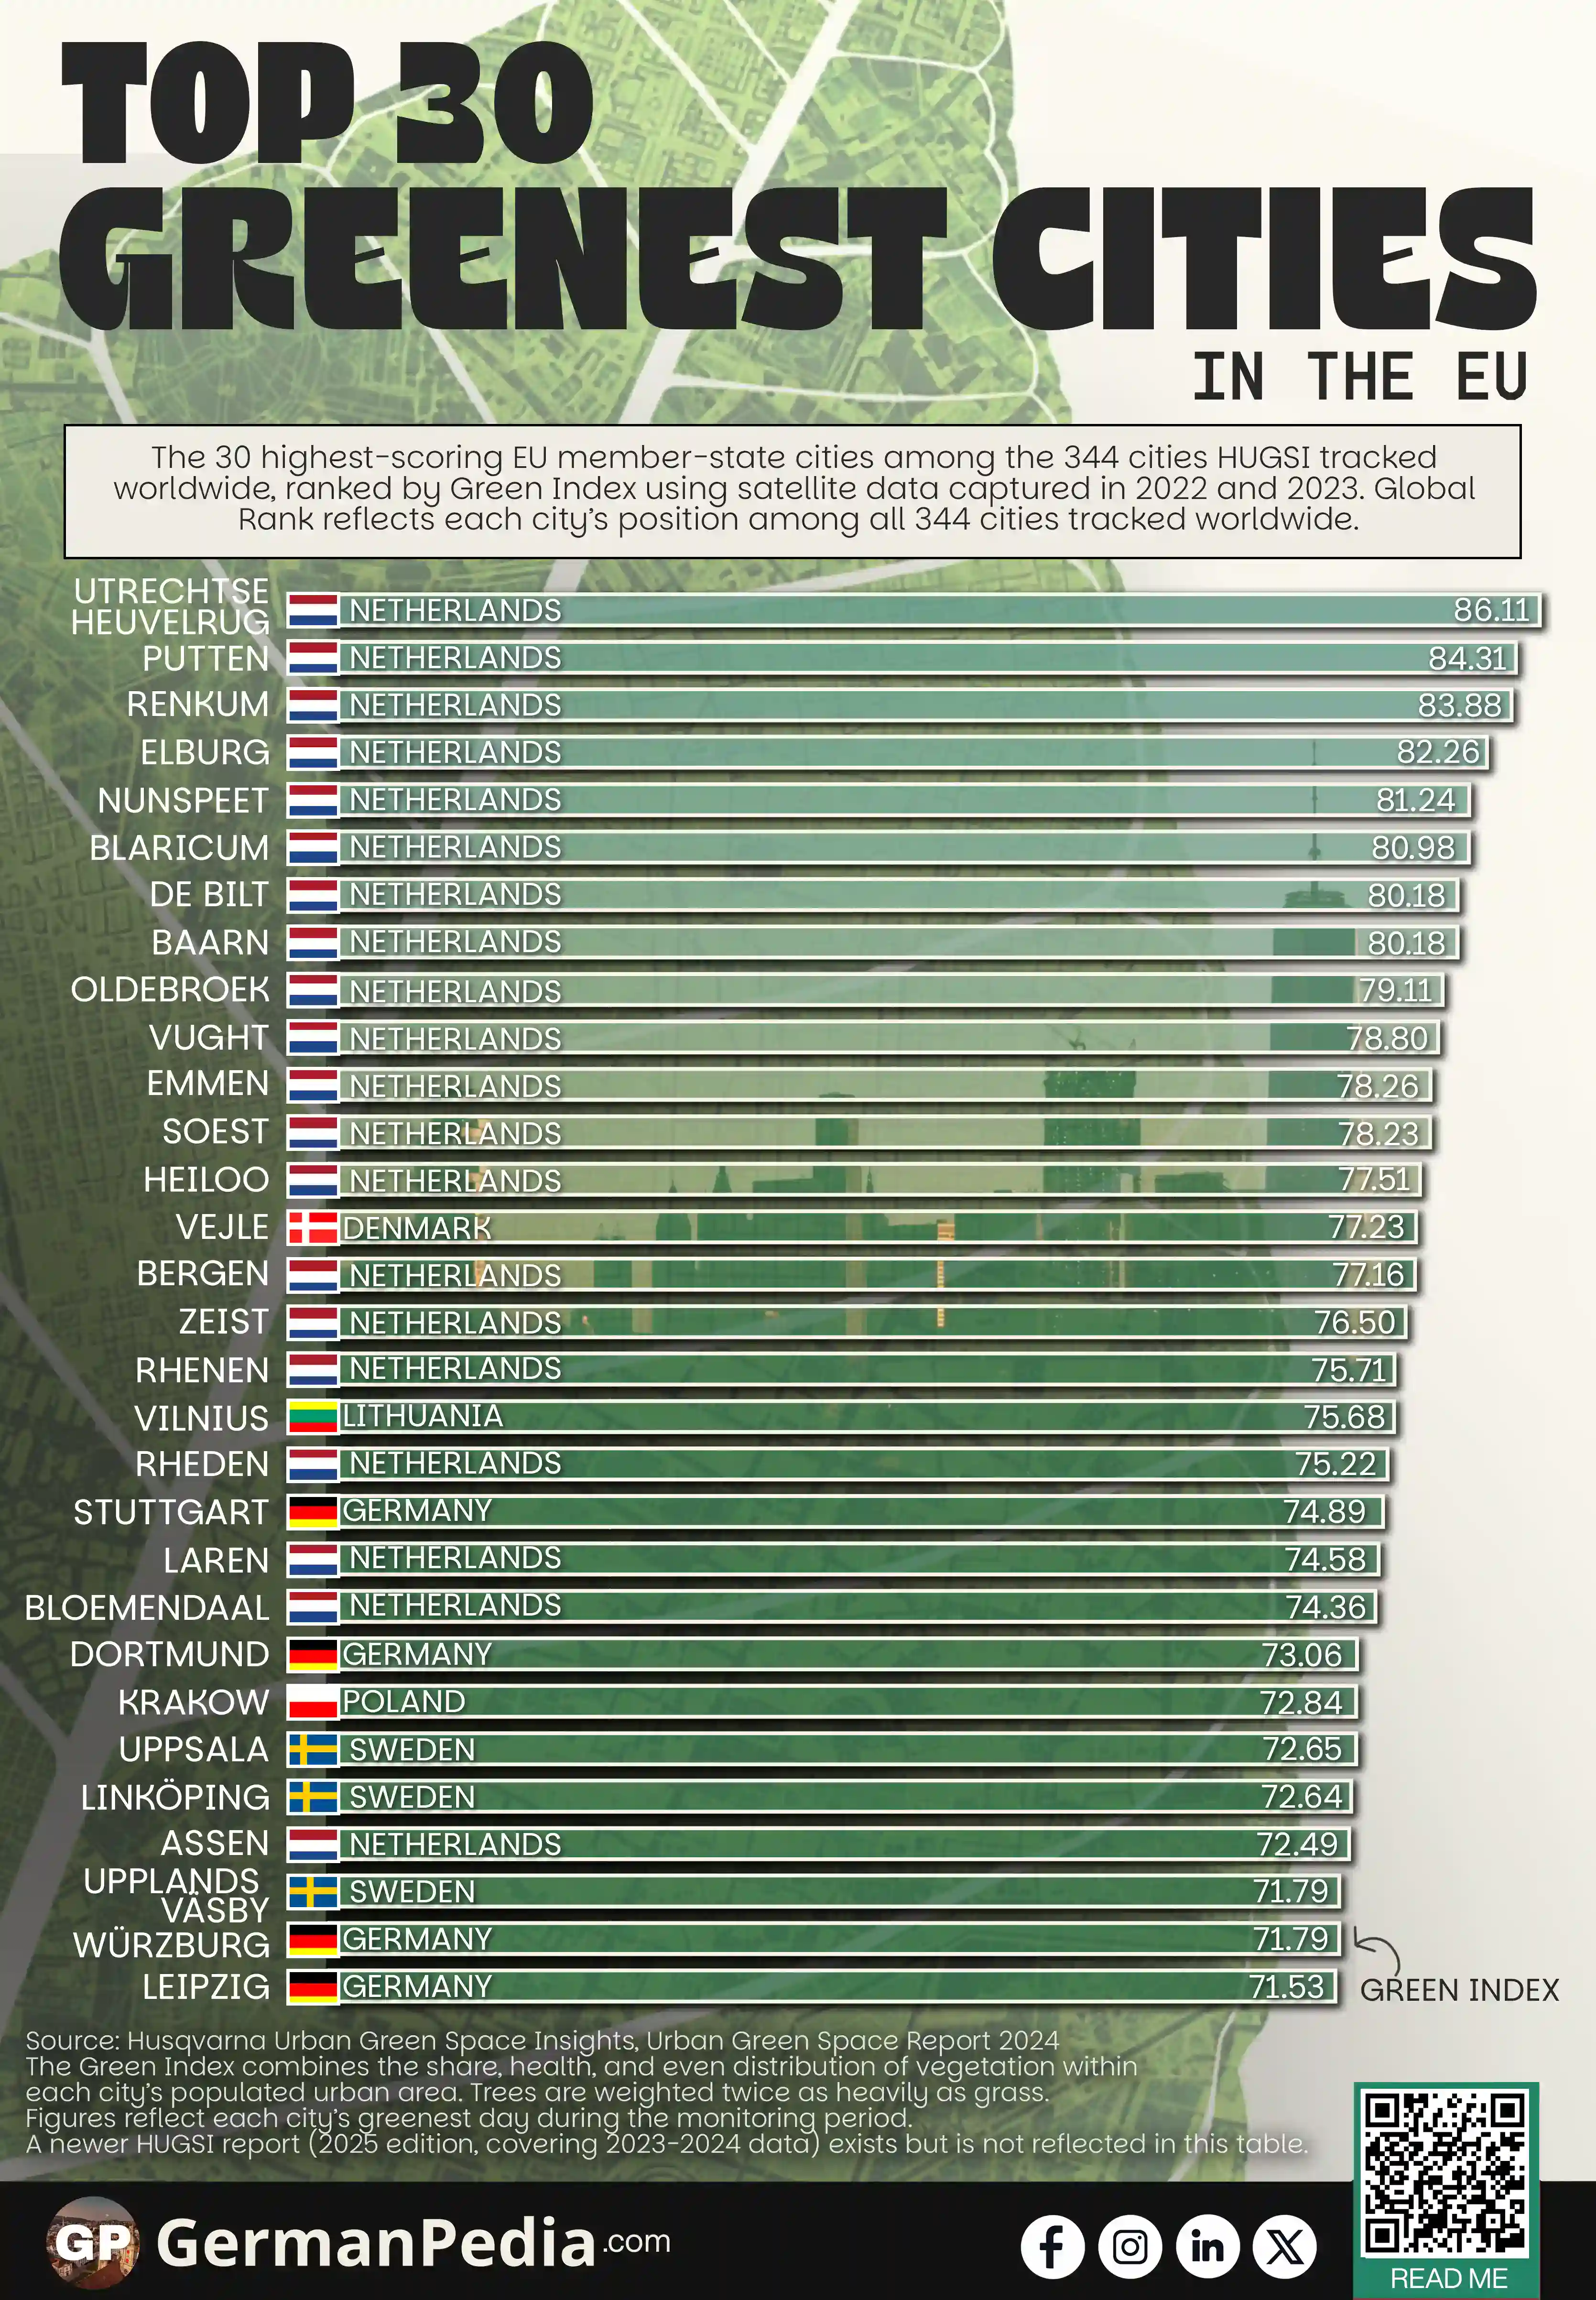
Use this Visualization: You may use this image for free with proper attribution to GermanPedia (i.e., by linking back to GermanPedia).
Need help communicating complex ideas visually? We help you turn data into your most persuasive story. Contact us to learn more.
EU Cities Ranked by Green Index
| Global Rank | City | Country | Green Index |
|---|---|---|---|
| 1 | Utrechtse Heuvelrug | Netherlands | 86.11 |
| 2 | Putten | Netherlands | 84.31 |
| 3 | Renkum | Netherlands | 83.88 |
| 4 | Elburg | Netherlands | 82.26 |
| 5 | Nunspeet | Netherlands | 81.24 |
| 6 | Blaricum | Netherlands | 80.98 |
| 7 | De Bilt | Netherlands | 80.18 |
| 8 | Baarn | Netherlands | 80.18 |
| 9 | Oldebroek | Netherlands | 79.11 |
| 10 | Vught | Netherlands | 78.80 |
| 11 | Emmen | Netherlands | 78.26 |
| 12 | Soest | Netherlands | 78.23 |
| 13 | Heiloo | Netherlands | 77.51 |
| 14 | Vejle | Denmark | 77.23 |
| 15 | Bergen | Netherlands | 77.16 |
| 17 | Zeist | Netherlands | 76.50 |
| 18 | Rhenen | Netherlands | 75.71 |
| 19 | Vilnius | Lithuania | 75.68 |
| 20 | Rheden | Netherlands | 75.22 |
| 21 | Stuttgart | Germany | 74.89 |
| 22 | Laren | Netherlands | 74.58 |
| 23 | Bloemendaal | Netherlands | 74.36 |
| 24 | Dortmund | Germany | 73.06 |
| 25 | Krakow | Poland | 72.84 |
| 26 | Uppsala | Sweden | 72.65 |
| 27 | Linköping | Sweden | 72.64 |
| 29 | Assen | Netherlands | 72.49 |
| 32 | Upplands Väsby | Sweden | 71.79 |
| 33 | Würzburg | Germany | 71.79 |
| 34 | Leipzig | Germany | 71.53 |
Source: Husqvarna Urban Green Space Insights, Urban Green Space Report 2024
The Green Index combines the share, health, and even distribution of vegetation within each city’s populated urban area. Trees are weighted twice as heavily as grass.
Figures reflect each city’s greenest day during the monitoring period.
A newer HUGSI report (2025 edition, covering 2023-2024 data) exists but is not reflected in this table.

20 of the EU’s 30 Greenest Cities Are in the Netherlands
The Netherlands’ 20 towns among the EU’s 30 greenest cities outnumber the other five EU countries combined.
Utrechtse Heuvelrug ranks first among the EU’s 30 greenest cities. Its Green Index is 86.11. Green space covers 74% of its urban area.
Green space refers to the parks, trees, and grass within a city, as opposed to buildings, roads, and other paved surfaces.
The Green Index also weighs trees twice as heavily as grass, so forest cover gives these towns an outsized boost.
Two geographic clusters of Dutch cities account for most of these top Green Index scores:
- Veluwe forest, Gelderland: Putten, Nunspeet, Elburg, Oldebroek
- Gooi region, east of Amsterdam: Blaricum, Laren, Bloemendaal
Both clusters’ borders run into existing forest, giving them far more tree cover than a typical town gets from parks alone.
The opposite holds for denser cities. A dense city core has far less room left for green space, no matter how many parks it builds. Roads, housing, and other paved surfaces take up most of that room instead.
None of the Netherlands’ largest or best-known cities (e.g., Amsterdam, Rotterdam) rank among the EU’s 30 greenest cities.
Every German City Among the EU’s 30 Greenest Cities Lost Green Space
Four German cities rank among the EU’s 30 greenest cities. But all four lost green space between 2022 and 2023.
Each German city’s Green Index appears below:
- Stuttgart: 74.89 Green Index
- Dortmund: 73.06 Green Index
- Würzburg: 71.79 Green Index
- Leipzig: 71.53 Green Index
The Netherlands’ twenty cities among the EU’s 30 greenest cities moved the opposite way. Eleven cities gained green space between 2022 and 2023. Two more cities held steady: Heiloo and Bloemendaal.
A national tree-planting initiative called Plan Boom may be part of the backdrop. It aimed to plant 10 million trees across the Netherlands. The program ran from 2019 to 2024.
The split between Germany and the Netherlands among the EU’s 30 greenest cities isn’t purely a country effect. Every one of the four German cities has a higher population density than every one of the twenty Dutch cities.
Denser cities have less undeveloped land to begin with, so more of their urban footprint goes to roads, housing, and other built surfaces instead of vegetation.
For scale, Germany’s population density averages 240 people per km² nationally. The Netherlands averages 547.
Würzburg is the least dense of the four German cities. It has 2,182 people per km². Meanwhile, Zeist is the densest of the twenty Dutch cities. It has 2,177.
The density gap between Germany and the Netherlands explains why Germany’s cities score lower as a group. It doesn’t explain which individual cities gained or lost ground, though.**
Zeist and Vught are both Dutch cities. Zeist gained green space between 2022 and 2023.
However, Vught has a lower density of 1,980 people per km². It lost green space instead.
Each German city’s Green Index reflects a single greenest day per year, not a full-year average. A one-year change can partly stem from which day was sampled rather than a lasting shift on the ground.
Vilnius Is the Only Capital Among the EU’s 30 Greenest Cities
Vilnius holds the 19th-highest Green Index among the 344 cities tracked worldwide. Vilnius’ Green Index is 75.68.
Among the 18 European capitals tracked separately, the average green-space share is 41%. Vilnius reaches 61%, the highest of the 18.
The European Commission separately named Vilnius the European Green Capital for 2025. The award recognized the city’s Green Wave initiative. That program is planting tens of thousands of new trees across Vilnius.
The clearest pattern behind the highest Green Index scores among the EU’s 30 greenest cities is about land, not size or fame. The Dutch towns bordering the Veluwe forest and the Gooi region posted some of the highest scores. This is because their urban footprints already include large stretches of woodland.
Vilnius reached a similarly high Green Index without that advantage. It did so through the Green Wave initiative instead.
Density didn’t predict change within the Dutch cities themselves. Each Green Index reflects only one sampled day per year. That limits how much weight a single year’s change should carry.
More topics
- Largest Religion in EU Countries
- Top Films in Germany Are Still Mostly Hollywood Hits
- Top 10 Highest Mountains in the EU
- Most Valuable Football Clubs in the EU
- Top Car-Producing Countries in the EU
- Top EU Countries by First-Instance Asylum Approvals
- Which Countries Does Germany Import From Most?
- Germany’s Top 10 Exported Goods
- Germany’s Top Export Partners: Where €1.55 Trillion in Goods Go
- Which EU Countries Export the Most Food?
- EU Relies on Imports for Natural Gas
- EU Household Expenditure on Food and Non-Alcoholic Beverages
- EU Countries Are Only Partly Self-Sufficient in Food
- Leading EU Exporters and Importers of Digitally Delivered Services
- US Oil Exports to the EU Are Highly Concentrated
References
- https://www.husqvarnagroup.com/sites/husqvarna/files/pr/202411115494-2.pdf
- https://environment.ec.europa.eu/topics/urban-environment/european-green-capital-award/winning-cities/vilnius-2025_en
- https://interlace-hub.com/plan-tree-plan-boom-netherlands
- https://www.worldometers.info/world-population/netherlands-population/