
What is the average sick leave per year in Germany?
Key Takeaways Average Sick Leave per Employee in Germany Year Average No. of Sick Leave (in working days) 1991 12.7 1992 12.7 1993 12.3 1994 12.4 1995 13.0 1996 12.0
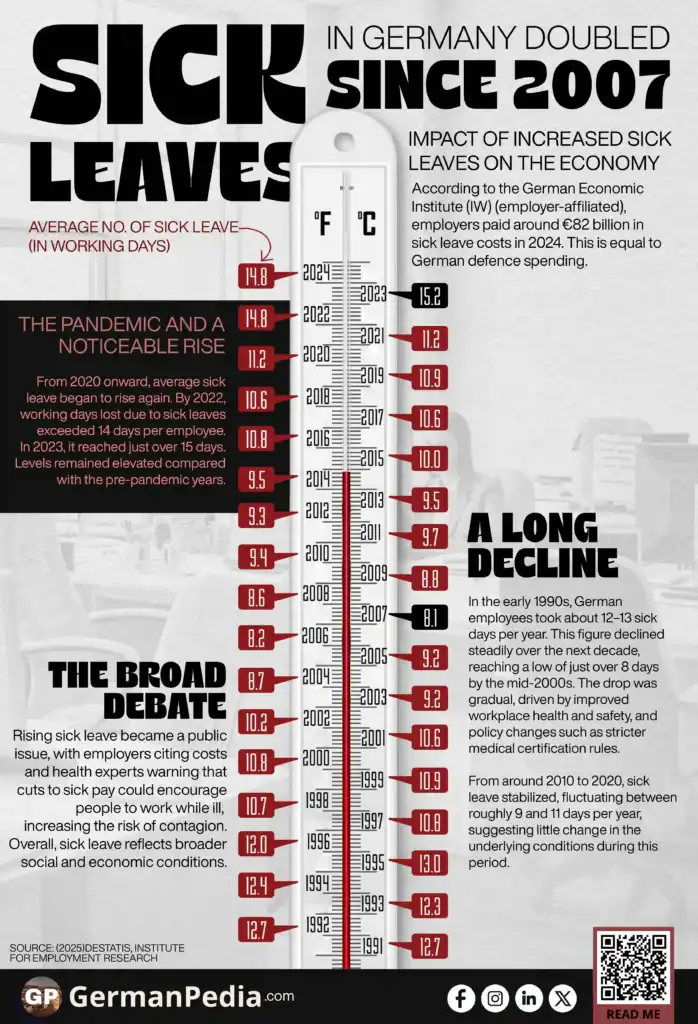
Key Takeaways Average Sick Leave per Employee in Germany Year Average No. of Sick Leave (in working days) 1991 12.7 1992 12.7 1993 12.3 1994 12.4 1995 13.0 1996 12.0

Key Takeaways Incidence rates of sexually transmitted diseases in Germany Rank Region Number of STD incidences (per 100,000 individuals) Syphilis Gonorrhea HIV incidence Total STD incidence 1 Berlin Friedrichshain-Kreuzberg 66.4

Key Takeaways Germany remains one of the world’s leading car manufacturing countries. It is the home to global brands such as Volkswagen, Mercedes-Benz, and BMW. Cars are not only a

Key Takeaways Employment by Federal State in Germany Federal state Population (In Millions) Total employed Employees Self-employed Nordrhein-Westfalen 9.84 9.09 (92.4%) 0.75 (7.6%) Bayern 7.89 7.21 (91.4%) 0.68 (8.6%) Baden-Württemberg
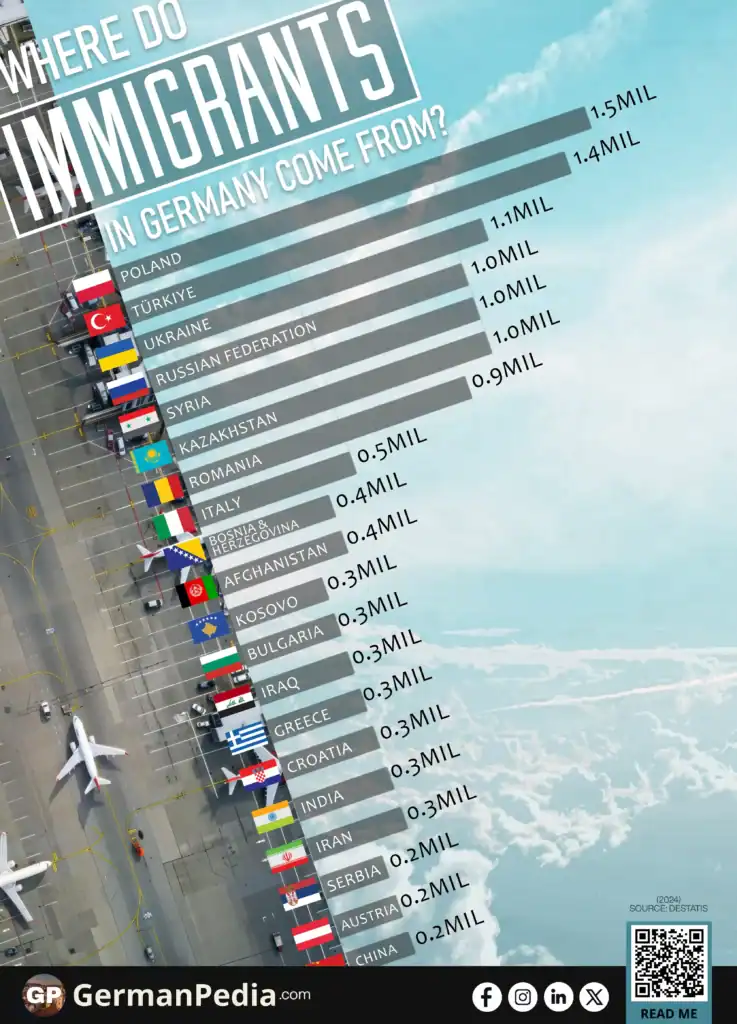
Key Takeaways First-Generation Immigrants in Germany Rank Country of birth Population (millions) 1 Poland 1.5 2 Türkiye 1.4 3 Ukraine 1.1 4 Russian Federation 1.0 5 Syria 1.0 6 Kazakhstan

Key Takeaways Germany’s Live Births per Federal State State Total Population (in Mil.) Total Births Total % Share of Total Population Nordrhein-Westfalen 17.99 147,962 22.6% Bayern 13.25 110,573 16.9% Baden-Württemberg
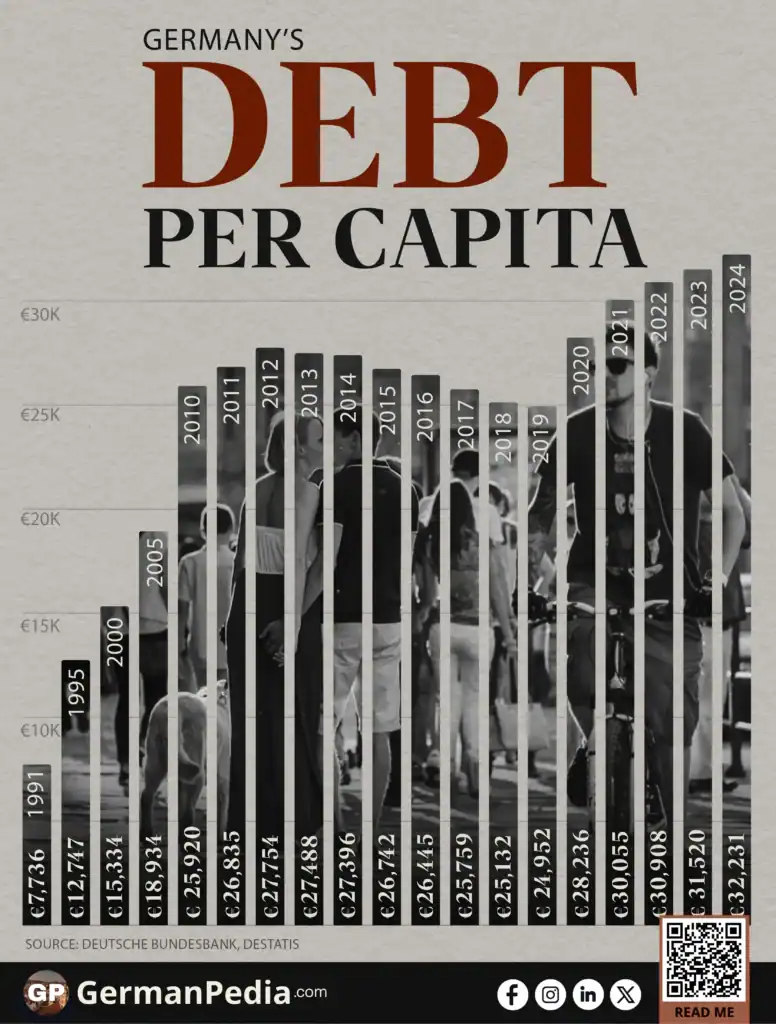
Key Takeaways Debt per Capita in Germany Over The Years Year Population (in millions) Debt (in trillion €) Debt per capita (in €) YoY change (in %) 1991 80.3 0.62 7,736

Key Takeaways Germany’s debt-to-GDP ratio compares total public debt to the size of the economy in a given year. The ratio does not move only when the government borrows more.
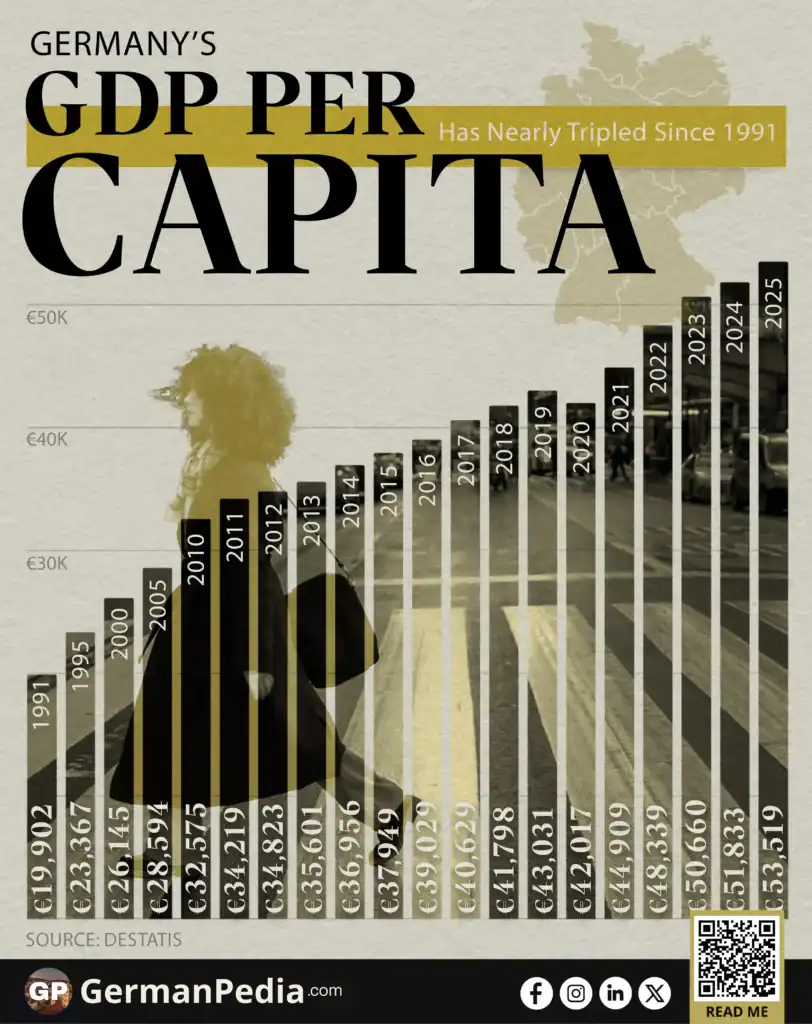
Key Takeaways Nominal GDP per Capita in Germany Year Gross Domestic Product Per Capita In € YoY change (In %) 1991 19,902 — 1992 21,241 6.7 1993 21,710 2.2 1994
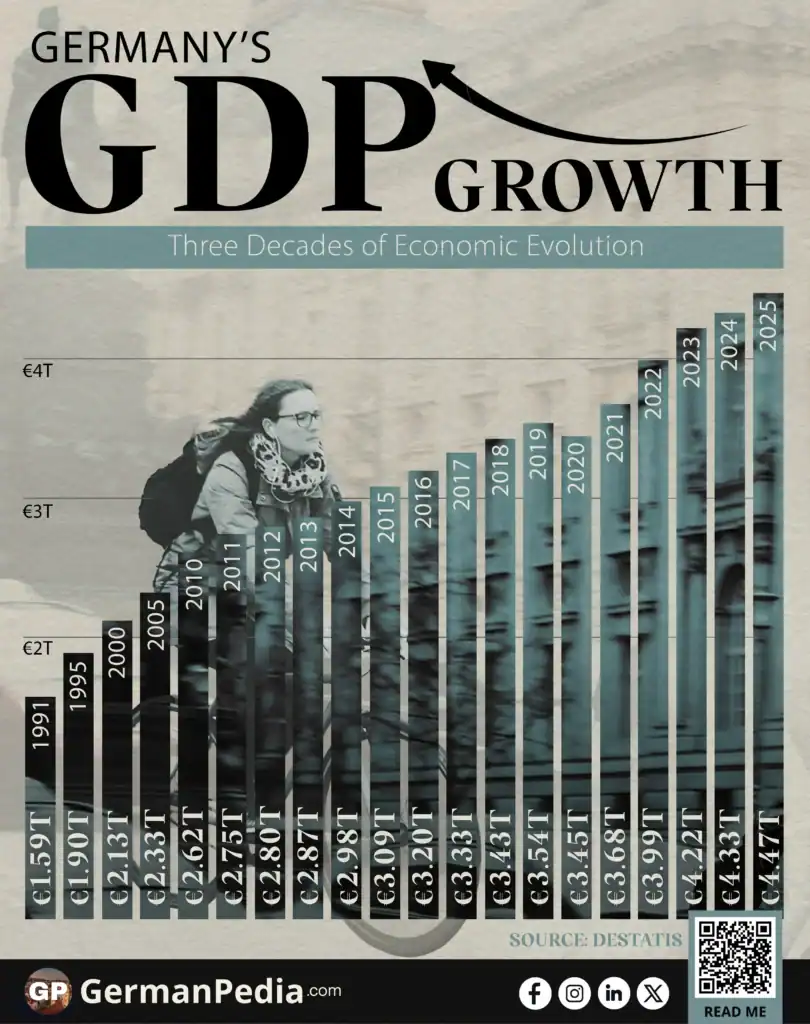
Key Takeaways Germany’s gross domestic product (GDP) measures the total value of all goods and services produced in the economy. Germany’s nominal GDP nearly tripled over three decades. It rose
You are currently viewing a placeholder content from Vimeo. To access the actual content, click the button below. Please note that doing so will share data with third-party providers.
More InformationYou are currently viewing a placeholder content from YouTube. To access the actual content, click the button below. Please note that doing so will share data with third-party providers.
More InformationYou need to load content from reCAPTCHA to submit the form. Please note that doing so will share data with third-party providers.
More InformationYou are currently viewing a placeholder content from Google Maps. To access the actual content, click the button below. Please note that doing so will share data with third-party providers.
More InformationYou are currently viewing a placeholder content from Google Maps. To access the actual content, click the button below. Please note that doing so will share data with third-party providers.
More InformationYou are currently viewing a placeholder content from Mapbox. To access the actual content, click the button below. Please note that doing so will share data with third-party providers.
More InformationYou are currently viewing a placeholder content from OpenStreetMap. To access the actual content, click the button below. Please note that doing so will share data with third-party providers.
More Information