Key Takeaways
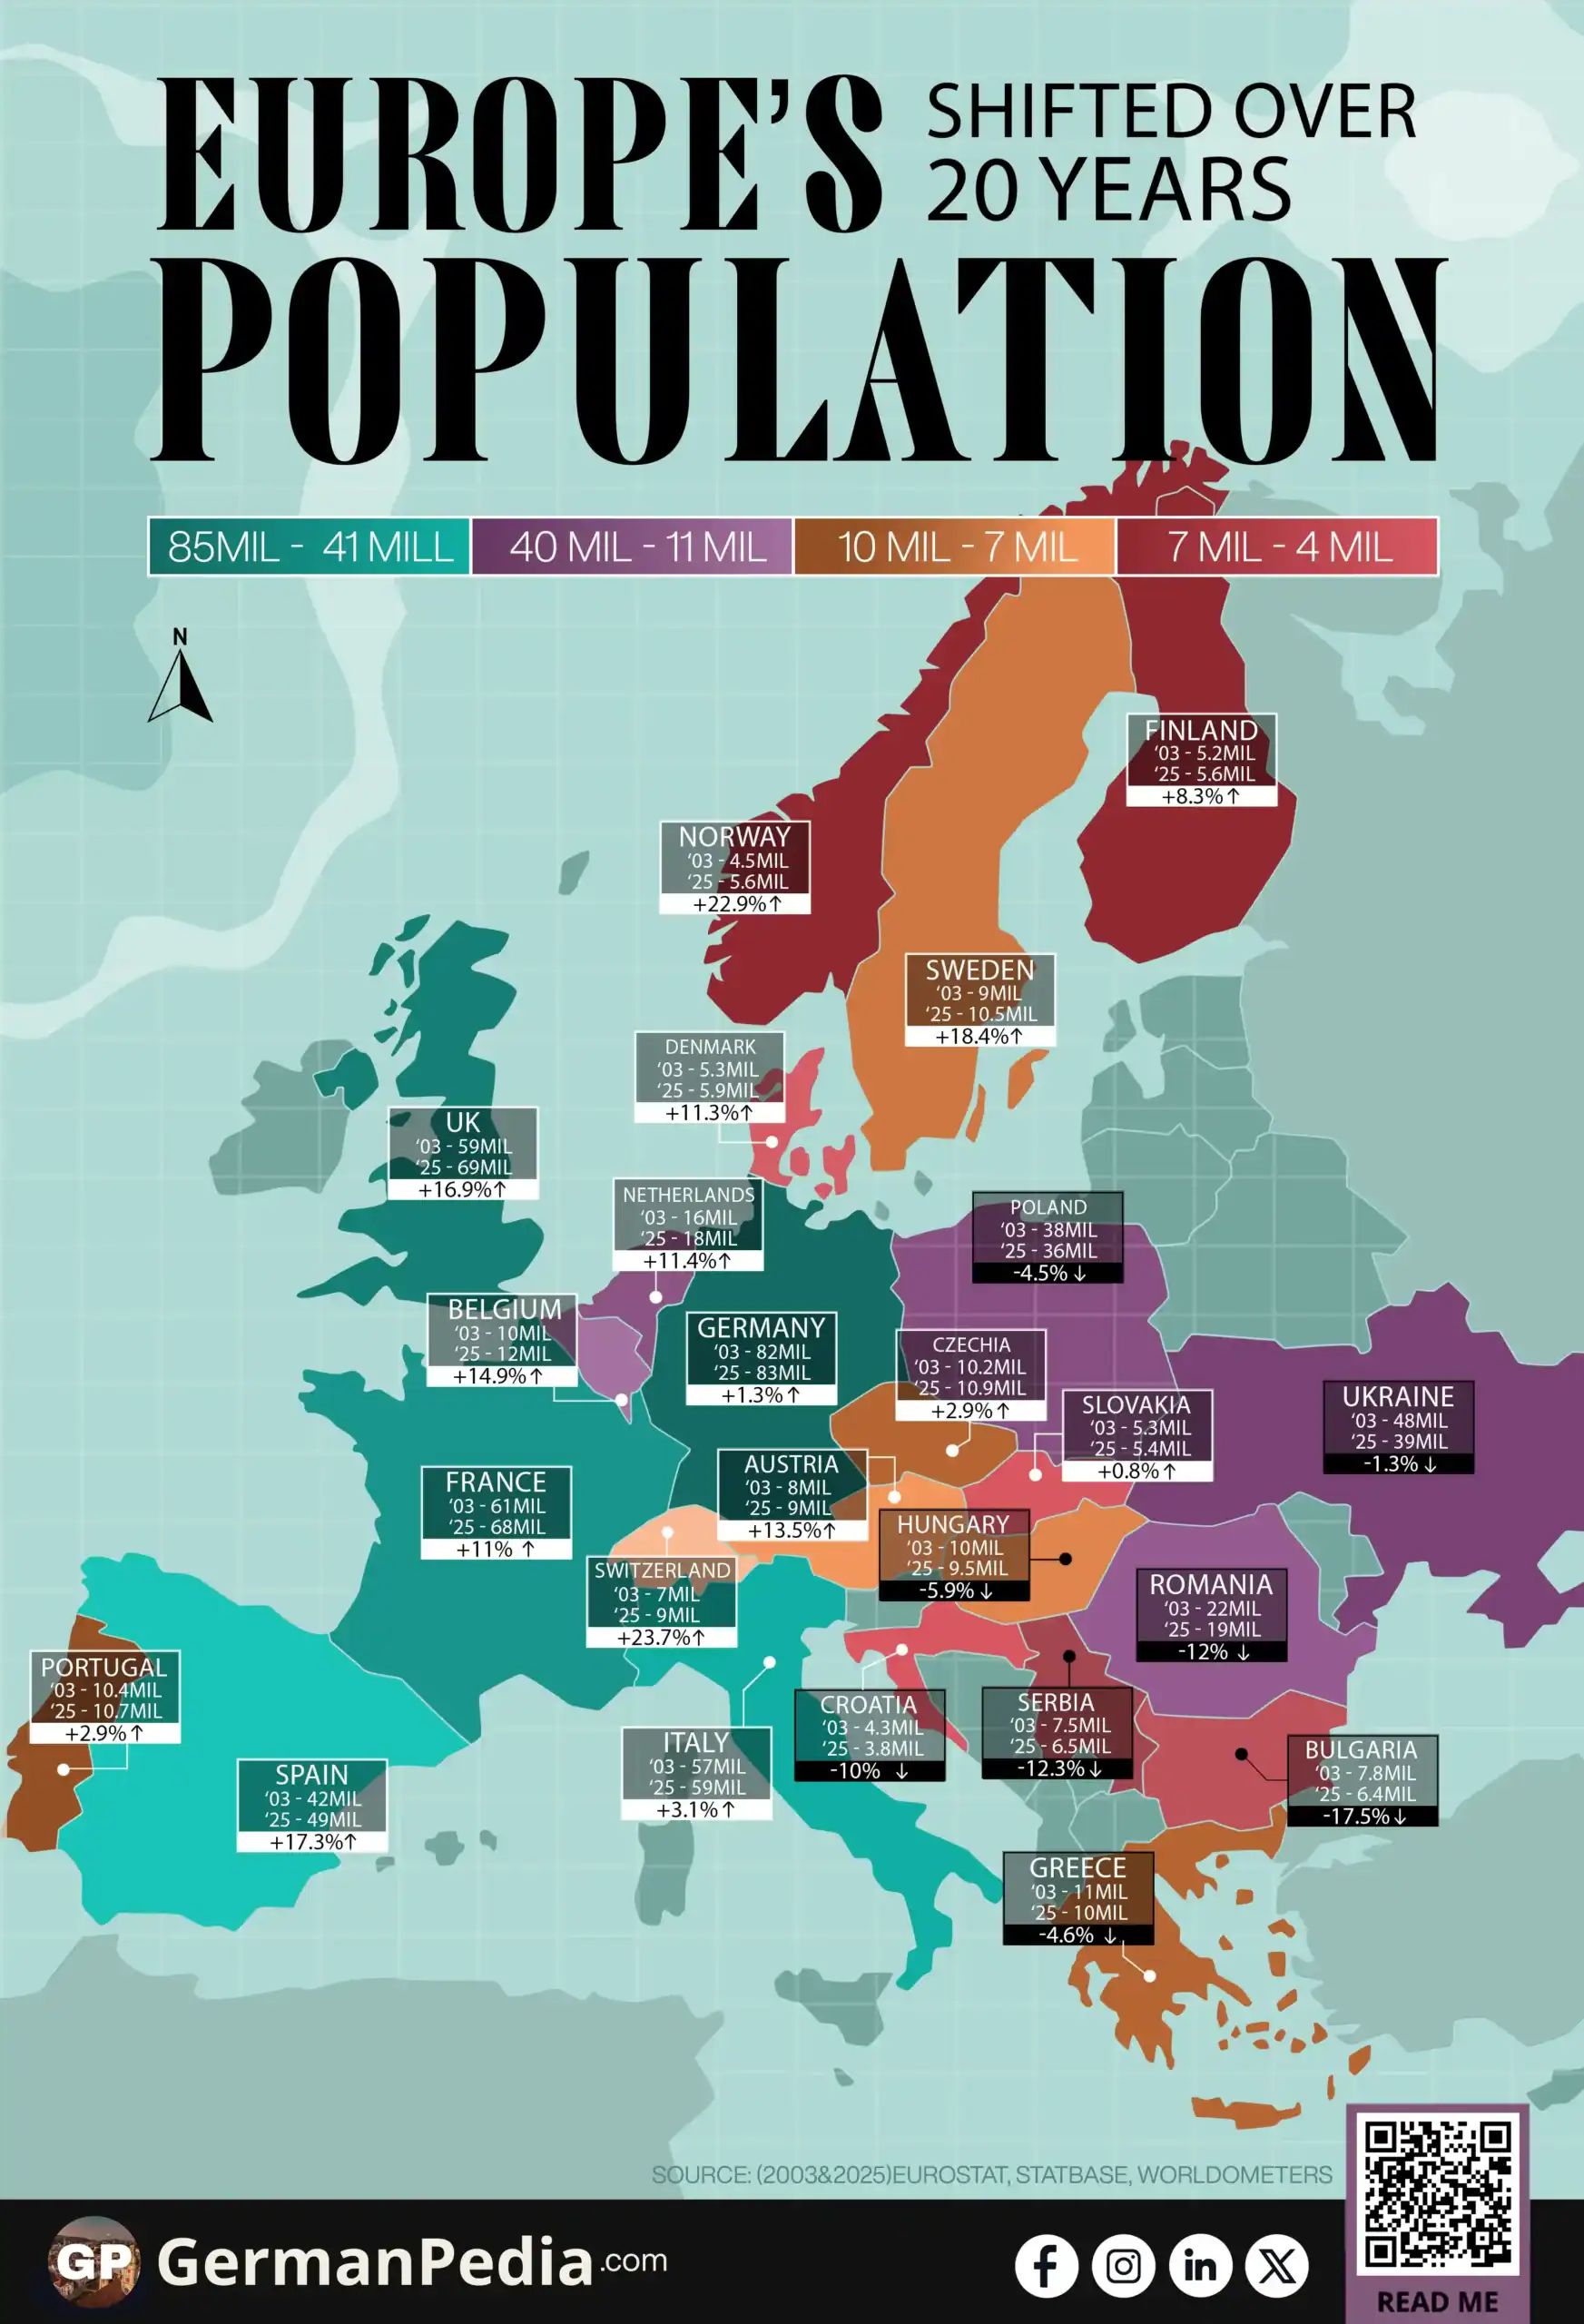
- Europe’s total population changed only modestly between 2003 and 2025. Meanwhile, the distribution of people across countries shifted significantly.
- Germany remains Europe’s most populous country. It grew slightly from 82.5 million in 2003 to 83.6 million in 2025. Its recent gains are driven mainly by migration.
- Eastern and Southeastern Europe experienced sustained population decline. This is mainly driven by low birth rates, ageing populations, and long-term emigration.
- The decline in Ukraine’s population began well before 2003. It was sharply accelerated after 2020 by war-related displacement.
- Northern and Western Europe gained population through net immigration, while much of the Balkans and parts of Eastern Europe lost residents to emigration. This reinforces a long-term east-to-west and south-to-north shift.
Use this Visualization: You may use this image for free with proper attribution to GermanPedia (i.e., by linking back to GermanPedia).
Need help communicating complex ideas visually? We help you turn data into your most persuasive story. Contact us to learn more.
Population of European Countries
| Rank | Country | Total Population | Change in % | |
| 2003 | 2025 | |||
| 1 | Germany | 82,536,680 | 83,577,140 | +1.3% |
| 2 | United Kingdom | 59,501,394 | 69,551,332** | +16.9% |
| 3 | France | 61,864,088 | 68,635,943 | +11.0% |
| 4 | Italy | 57,186,378 | 58,934,177 | +3.1% |
| 5 | Spain | 41,827,838 | 49,077,984 | +17.3% |
| 6 | Ukraine | 47,823,108 | 38,980,376** | −18.5% |
| 7 | Poland | 38,218,531 | 36,497,495 | −4.5% |
| 8 | Romania | 21,627,509 | 19,036,031 | −12.0% |
| 9 | Netherlands | 16,192,572 | 18,044,027 | +11.4% |
| 10 | Belgium | 10,355,844 | 11,900,123 | +14.9% |
| 11 | Greece | 10,915,770 | 10,409,547 | −4.6% |
| 12 | Portugal | 10,444,592 | 10,749,635 | +2.9% |
| 13 | Czechia | 10,192,649 | 10,909,500 | +7.0% |
| 14 | Sweden | 8,940,788 | 10,587,710 | +18.4% |
| 15 | Hungary | 10,142,362 | 9,539,502 | −5.9% |
| 16 | Austria | 8,100,273 | 9,197,213 | +13.5% |
| 17 | Switzerland | 7,313,853 | 9,048,905 | +23.7% |
| 18 | Serbia | 7,490,918 | 6,567,783 | −12.3% |
| 19 | Bulgaria | 7,805,506 | 6,437,360 | −17.5% |
| 20 | Denmark | 5,383,507 | 5,992,734 | +11.3% |
| 21 | Finland | 5,206,295 | 5,635,971 | +8.3% |
| 22 | Norway | 4,552,252 | 5,594,340 | +22.9% |
| 23 | Ireland | 3,964,191 | 5,439,898 | +37.2% |
| 24 | Slovakia | 5,374,873 | 5,419,451 | +0.8% |
| 25 | Croatia | 4,305,384 | 3,874,350 | −10.0% |
| 26 | Georgia | 4,352,600** | 3,704,506 | −14.9% |
| 27 | Bosnia and Herzegovina | 3,830,349** | 3,406,568 | −11.1% |
| 28 | Lithuania | 3,431,497 | 2,890,664 | −15.8% |
| 29 | Moldova | 3,618,312 | 2,381,325 | −34.2% |
| 30 | Albania | 3,044,993 | 2,363,314 | −22.4% |
| 31 | Slovenia | 1,995,033 | 2,130,850 | +6.8% |
| 32 | Latvia | 2,299,390 | 1,856,932 | −19.2% |
| 33 | North Macedonia | 2,023,654 | 1,822,612 | −9.9% |
| 34 | Kosovo* | 1,985,000 | 1,674,125** | −15.7% |
| 35 | Estonia | 1,375,190 | 1,369,995 | −0.4% |
| 36 | Cyprus | 713,720 | 979,865 | +37.3% |
| 37 | Luxembourg | 448,300 | 681,973 | +52.1% |
| 38 | Montenegro | 610,510 | 623,327 | +2.1% |
| 39 | Malta | 397,296 | 574,250 | +44.6% |
| 40 | Iceland | 288,471 | 389,444 | +35.0% |
| 41 | Liechtenstein | 33,863 | 40,885 | +20.7% |
Source: Eurostat, Statbase, Worldometers
*Break in time series
**Estimated

Europe’s Population Has Barely Grown
Between 2003 and 2025, Europe’s total population changed far less than its economy or politics. Growth was limited, but movement within Europe was significant.
How did European countries’ GDP change over the years? ->
How did Germany’s GDP change over three decades? ->
Germany has remained Europe’s most populous country over the past two decades. Its population dipped slightly between 2003 and 2015, then rose again to about 83.6 million in 2025. This is largely driven by migration rather than natural growth.
France shows one of the clearest long-term increases. Its population grew steadily from about 61.9 million in 2003 to nearly 68.6 million in 2025. The United Kingdom follows a similar pattern. It rose from 59 million to an estimated 69.6 million over the same period.
Population in Eastern European Countries Is Shrinking
The most consistent population losses appear in Eastern and Southeastern Europe.
Poland, once stable, has declined to a population of about 36.5 million. Romania has lost more than 2.5 million people since 2003. Bulgaria and much of the Baltic region follow the same downward trend.
These declines reflect a combination of low birth rates, ageing populations, and long-term emigration, particularly since EU enlargement. The change has been gradual but cumulative.
The case of Ukraine stands apart. Its population had been declining steadily since the early 2000s [1]. After 2020, that long-term trend was sharply accelerated by war-related displacement.
Small Countries, Clear Population Trends
Smaller European countries make these shifts in population numbers easier to see. In Northern and Western Europe, population growth has been steady:
- Ireland: 4.0 → 5.4 million
- Sweden: 8.9 → 10.6 million
- Norway: 4.6 → 5.6 million
- Netherlands: 16.2 → 18.0 million
These countries combine net immigration, strong labour demand, and relatively stable fertility.
By contrast, much of the Balkans continued to lose population year after year. This is driven mainly by emigration:
- Serbia: 7.5 → 6.6 million
- Bosnia and Herzegovina: 3.8 → 3.4 million
- Albania: 3.0 → 2.4 million
Microstates show the same pattern at a smaller scale. Luxembourg, Malta, and Iceland grew steadily, while Monaco and Liechtenstein remained broadly stable, with changes measured in thousands rather than millions.
Over the past two decades, Europe’s population changed little overall. What changed was where people live. Population increasingly shifted from Eastern and Southeastern Europe toward Western and Northern countries with larger job markets and higher wages [4] [5]. As a result, parts of the east and south lost population, while a smaller group of northern and western countries grew. Europe became less different in population size and more rearranged in location.
More topics
- Top 25 Richest People in Germany (2025)
- Germany’s Smoking Rate Has Declined Over Two Decades
- Germany’s Electricity Mix: From Coal to Renewables
- Changes in Harvest of Germany’s Five Key Crops
- Top German Companies by Revenue
- Germany’s Top Car Brands by New Registrations
- Unemployment Across Germany: A Federal State Breakdown
- Where Germany’s Tourists Come From
- Germany’s Largest National Parks, Ranked by Size
- Which Federal States Drive Germany’s Economy?
- Here’s Why Divorces in Germany Are Falling
- Germans Are Marrying Later Than Ever
- How Marriage Rates Have Fallen in Germany: 1990–2023
- How Germany’s Birth Rates Dropped and Deaths Rose
- Leading Causes of Death in Germany
References
- https://ec.europa.eu/eurostat/databrowser/view/DEMO_GIND__custom_10293339/
- https://statbase.org/data/xkx-population/#:~:text=Overview&text=The+estimated+population+of+Kosovo,values+shown+are+midyear+estimates.
- https://www.worldometers.info/world-population/ukraine-population/
- https://economy-finance.ec.europa.eu/migration-mobility-and-eu-labour-market_en?
- https://employment-social-affairs.ec.europa.eu/news/annual-report-intra-eu-labour-mobility-2024-published-2025-02-07_en?