Key Takeaways
- Europe’s nominal GDP grew across almost all countries between 2016 and 2024. However, the overall ranking of countries changed very little, even after major shocks such as Brexit or the pandemic.
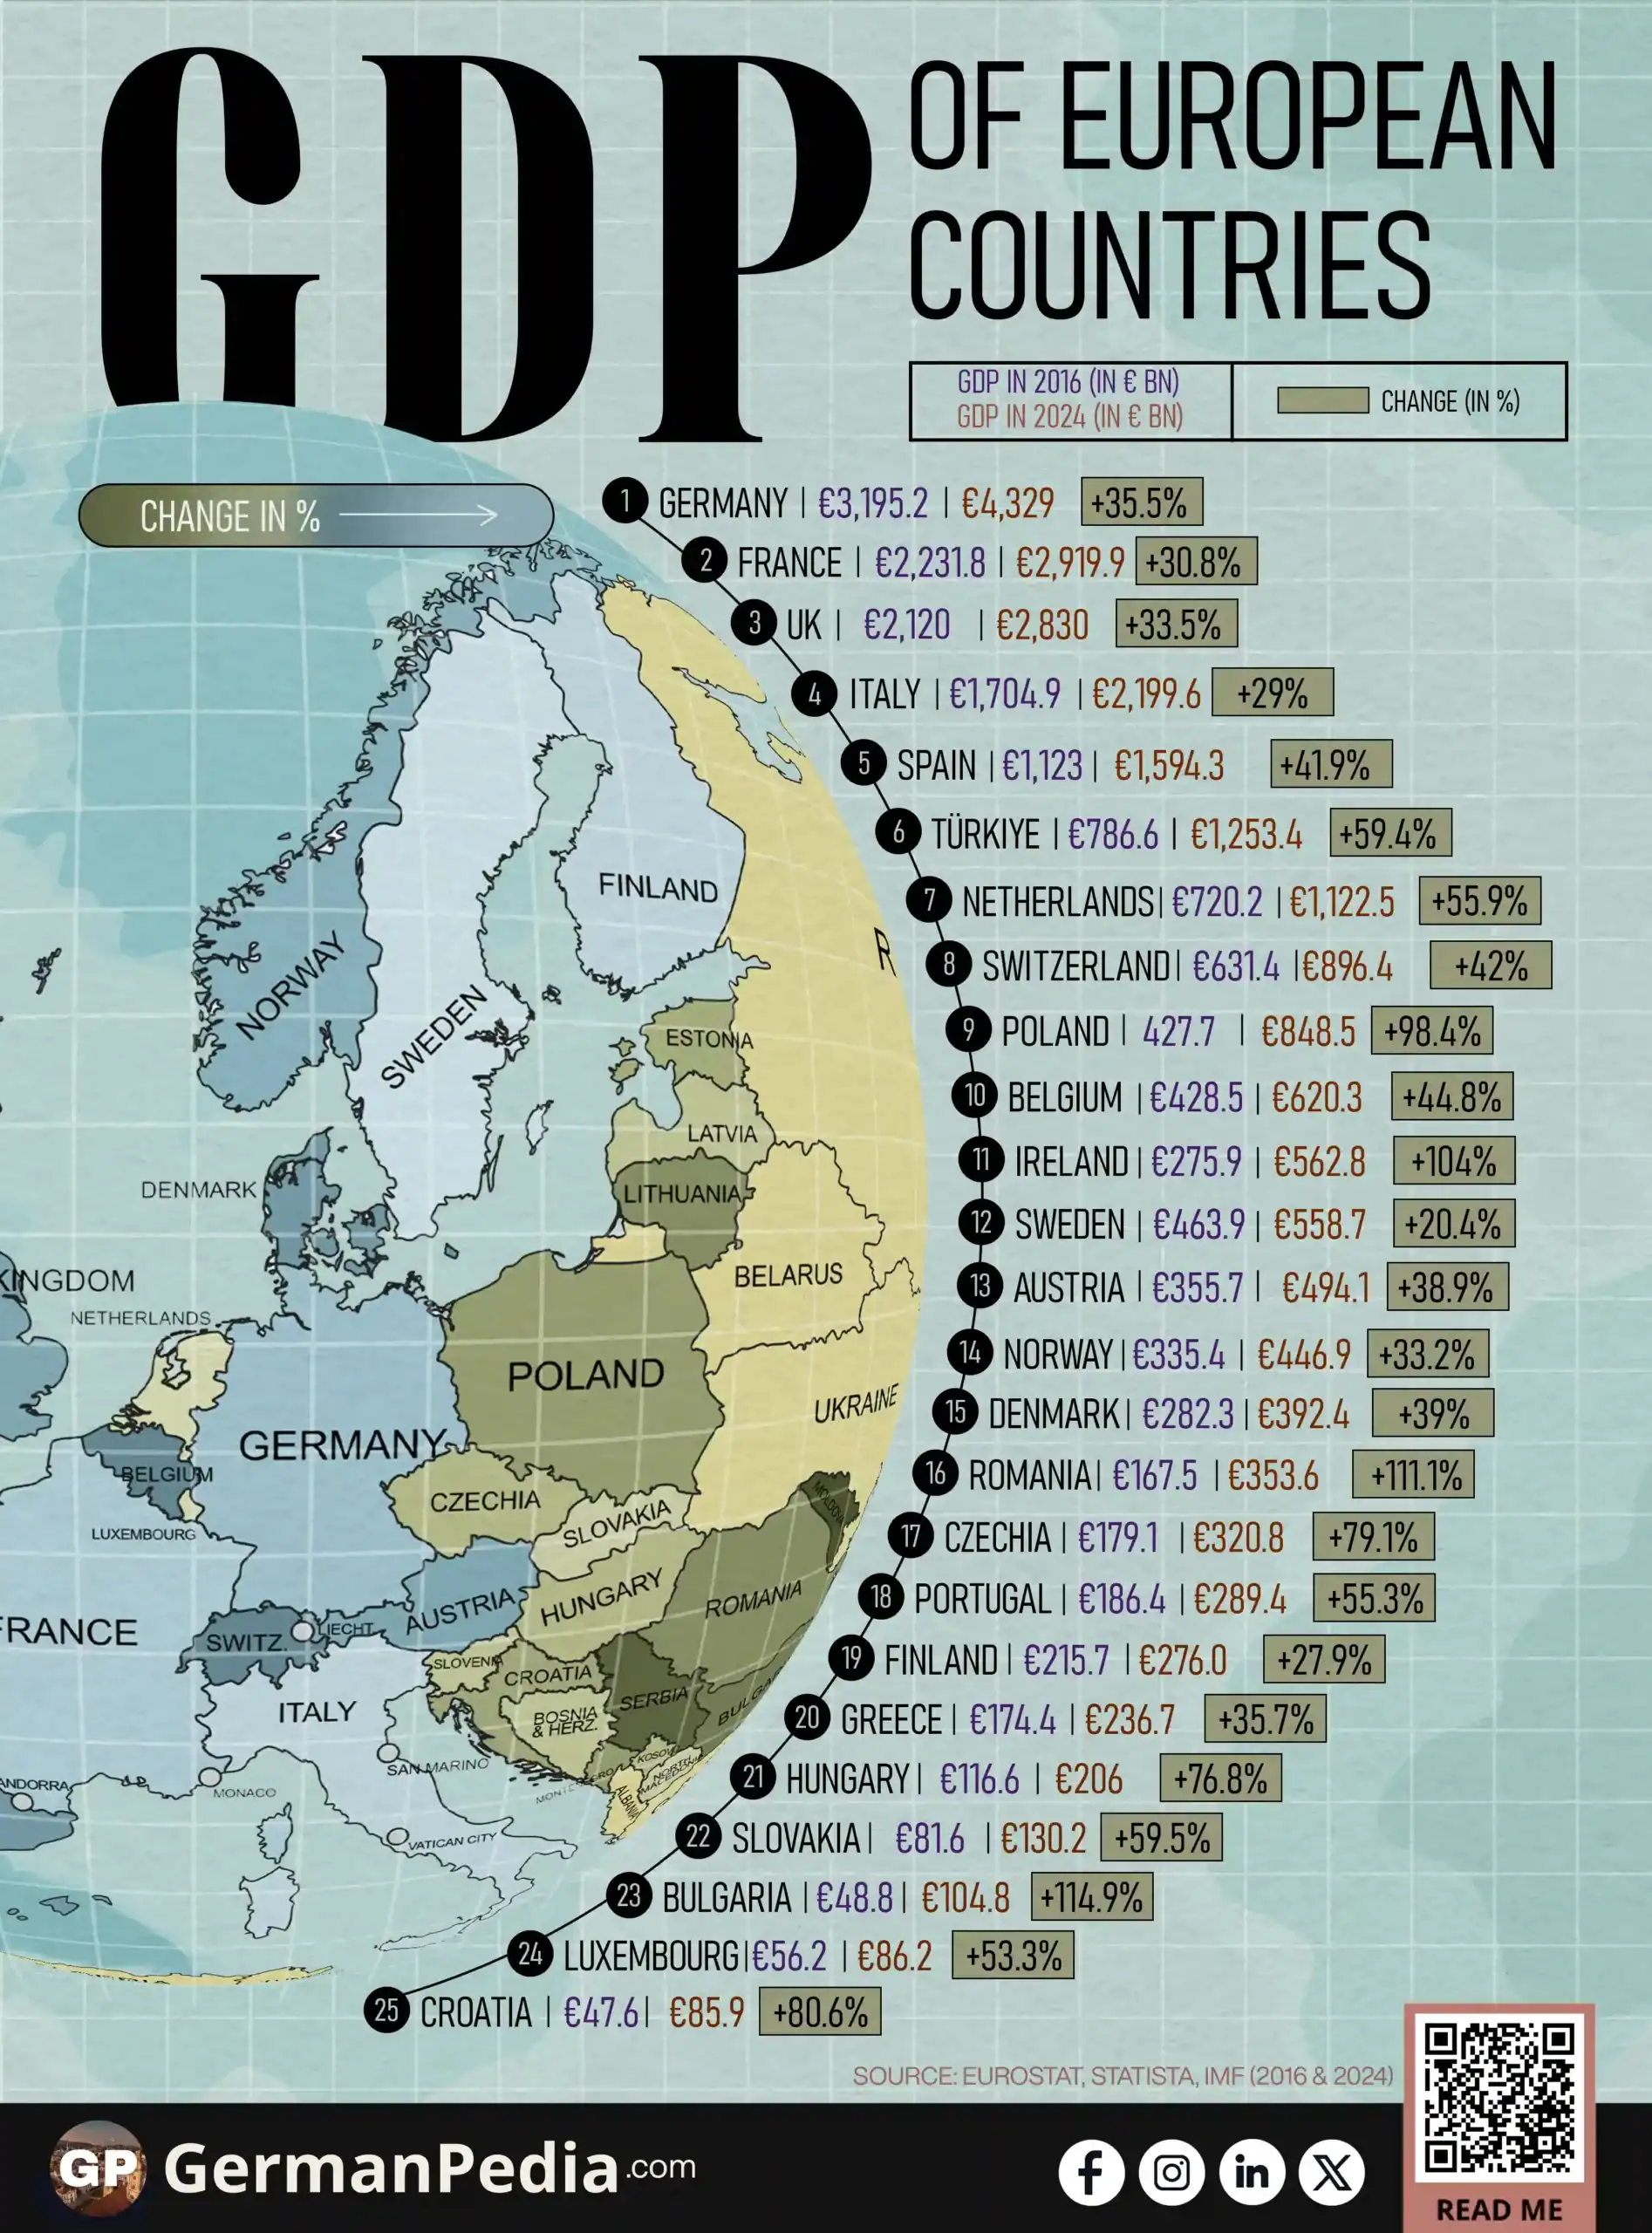
- Germany remains Europe’s largest economy. It grew from about €3.2 trillion in 2016 to €4.3 trillion in 2024.
- Germany, France, the United Kingdom, Italy, and Spain continued to account for a dominant share of Europe’s total economic output in both 2016 and 2024
- Smaller economies often grew faster, but rapid growth did not translate into a higher rank. This reflects catch-up effects, EU integration, and inflation, rather than a shift in economic power.
- Ireland is a notable outlier, where nominal GDP growth is heavily influenced by multinational accounting and does not fully reflect domestic economic activity.
Use this Visualization: You may use this image for free with proper attribution to GermanPedia (i.e., by linking back to GermanPedia).
Need help communicating complex ideas visually? We help you turn data into your most persuasive story. Contact us to learn more.
European Countries’ Nominal GDP
| Rank | Country | GDP (in € bn) | Change in % | |
|---|---|---|---|---|
| 2016 | 2024 | |||
| 1 | Germany | 3,195.2 | 4,329.0 | +35.5% |
| 2 | United Kingdom* | 2,434.1 | 2,571.0* | +5.62% |
| 3 | France | 2,231.8 | 2,919.9 | +30.8% |
| 4 | Italy | 1,704.9 | 2,199.6 | +29.0% |
| 5 | Spain | 1,123.0 | 1,594.3 | +41.9% |
| 6 | Türkiye | 786.6 | 1,253.4 | +59.4% |
| 7 | Netherlands | 720.2 | 1,122.5 | +55.9% |
| 8 | Switzerland | 631.4 | 896.4 | +42.0% |
| 9 | Poland | 427.7 | 848.5 | +98.4% |
| 10 | Belgium | 428.5 | 620.3 | +44.8% |
| 11 | Ireland | 275.9 | 562.8 | +104.0% |
| 12 | Sweden | 463.9 | 558.7 | +20.4% |
| 13 | Austria | 355.7 | 494.1 | +38.9% |
| 14 | Norway | 335.4 | 446.9 | +33.2% |
| 15 | Denmark | 282.3 | 392.4 | +39.0% |
| 16 | Romania | 167.5 | 353.6 | +111.1% |
| 17 | Czechia | 179.1 | 320.8 | +79.1% |
| 18 | Portugal | 186.4 | 289.4 | +55.3% |
| 19 | Finland | 215.7 | 276.0 | +27.9% |
| 20 | Greece | 174.4 | 236.7 | +35.7% |
| 21 | Hungary | 116.6 | 206.0 | +76.8% |
| 22 | Slovakia | 81.6 | 130.2 | +59.5% |
| 23 | Bulgaria | 48.8 | 104.8 | +114.9% |
| 24 | Luxembourg | 56.2 | 86.2 | +53.3% |
| 25 | Croatia | 47.6 | 85.9 | +80.6% |
| 26 | Serbia | 38.2 | 83.3 | +118.2% |
| 27 | Lithuania | 38.8 | 79.0 | +103.5% |
| 28 | Slovenia | 40.0 | 67.4 | +68.5% |
| 29 | Latvia | 24.5 | 40.4 | +64.8% |
| 30 | Estonia | 22.2 | 39.8 | +79.6% |
| 31 | Cyprus | 19.0 | 34.8 | +82.9% |
| 32 | Iceland | 19.1 | 30.7 | +61.0% |
| 33 | Bosnia and Herzegovina | 15.5 | 26.2 | +69.3% |
| 34 | Albania | 10.8 | 25.0 | +130.7% |
| 35 | Malta | 10.9 | 23.1 | +112.9% |
| 36 | Moldova | 7.4* | 16.8* | +127.0% |
| 37 | North Macedonia | 9.7 | 15.7 | +62.3% |
| 39 | Kosovo | 6.0 | 10.4 | +71.4% |
| 40 | Montenegro | 3.9 | 7.6 | +94.2% |
| 41 | Liechtenstein | 6.5 | — | — |
Source: Eurostat, Statista, IMF
GDP measures the total value of everything a country produces in a year. “At market prices” means this value includes taxes such as VAT, which is the standard way GDP is reported internationally.
These figures follow ESA 2010. It is the EU’s shared accounting rulebook for measuring GDP. It ensures Eurostat calculates GDP the same way for every country, so figures can be fairly compared.
These are nominal GDP figures. That means they are not adjusted for inflation. GDP can rise because a country produces more, or simply because prices go up. Nominal figures don’t separate the two. Some of the growth shown between 2016 and 2024 reflects higher prices, not only a larger economy.
*Figures for the United Kingdom (2024) and Moldova (2016 and 2024) were originally reported in US dollars and converted to euros. The 2024 conversion uses an average rate of 1 USD = 0.9243 EUR.

In 2024, Germany remains Europe’s largest economy, with a gross domestic product of about €4.3 trillion.
How did Germany’s GDP grow over three decades? ->
How has Germany’s GDP-to-debt ratio changed since 2000? ->
France follows at just under €3 trillion, with the United Kingdom close behind at €2.8 trillion. Italy and Spain complete the top five. Together, these countries still account for a dominant share of Europe’s total economic output, just as they did in 2016.
What stands out is not the size of the growth, but how little the ranking changed. Europe’s largest economies remain firmly in place even after major disruptions like Brexit and the pandemic.
GDP Growth Rates Don’t Reorder the Ranking
The fastest growth rates in terms of GDP appear outside Europe’s economic core.
Countries such as Romania (+111%), Bulgaria (+115%), Poland (+98%), and several Baltic and Balkan states recorded some of the strongest nominal GDP growth between 2016 and 2024.
This reflects catch-up dynamics, EU integration, and inflation effects acting on much smaller starting points. High growth rates look dramatic because the base is small. It is not because these economies are overtaking Europe’s largest players.
Poland illustrates this clearly. Its GDP nearly doubled to €849 billion in 2024. However, its GDP remains far smaller than Germany, France, or the United Kingdom.
Germany, by contrast, grew more slowly than many Eastern European economies. However, its starting point was so large that even moderate growth added hundreds of billions of euros. Smaller economies can grow faster for years without closing that gap.
Ireland is an important outlier. Its GDP more than doubled over the period, but much of this increase reflects how multinational companies record profits there. As a result, headline GDP growth overstates changes in everyday economic activity.
Across the table, the same pattern repeats. Speed reshapes trajectories, but scale preserves hierarchy.
Europe has grown almost everywhere since 2016. But when measured by economic weight, its center of gravity remains largely where it was.
More topics
- Top 25 Richest People in Germany (2025)
- Germany’s Smoking Rate Has Declined Over Two Decades
- Germany’s Electricity Mix: From Coal to Renewables
- Changes in Harvest of Germany’s Five Key Crops
- Top German Companies by Revenue
- Germany’s Top Car Brands by New Registrations
- Unemployment Across Germany: A Federal State Breakdown
- Where Germany’s Tourists Come From
- Germany’s Largest National Parks, Ranked by Size
- Which Federal States Drive Germany’s Economy?
- Here’s Why Divorces in Germany Are Falling
- Germans Are Marrying Later Than Ever
- How Marriage Rates Have Fallen in Germany: 1990–2023
- How Germany’s Birth Rates Dropped and Deaths Rose
- Leading Causes of Death in Germany
References
- https://ec.europa.eu/eurostat/databrowser/view/nama_10_gdp/default/table?lang=en&category=na10.nama10.nama_10_ma
- https://www.statista.com/statistics/281744/gdp-of-the-united-kingdom/
- https://www.statista.com/statistics/513333/gross-domestic-product-gdp-in-moldova/?srsltid=AfmBOoowyOscNKoJWWacm_P1y_Bj4g4UTS0xSZkqG8OCl1yMEvegLocQ
- https://www.imf.org/-/media/files/publications/cr/2025/english/1lieea2025002-print-pdf.pdf