Key Takeaways
- The EU recorded 4,812,382 deaths in 2025.
- Bulgaria posts the highest crude death rate in the EU at 15.5 deaths per 1,000 people.
- Luxembourg posts the lowest crude death rate in the EU at 6.4 deaths per 1,000 people. Ireland and Cyprus follow closely at 6.5 and 6.9.
- Germany recorded the most deaths of any EU country in 2025. Its total of 1,006,588 is the only count to pass 1 million.
- Germany’s crude death rate ranks only 7th highest in the EU. It reaches 12.1 deaths per 1,000.
- Age structure explains much of the divide in death rates across the EU. Bulgaria has the EU’s third-oldest population, while Luxembourg, Ireland, and Cyprus have its youngest.
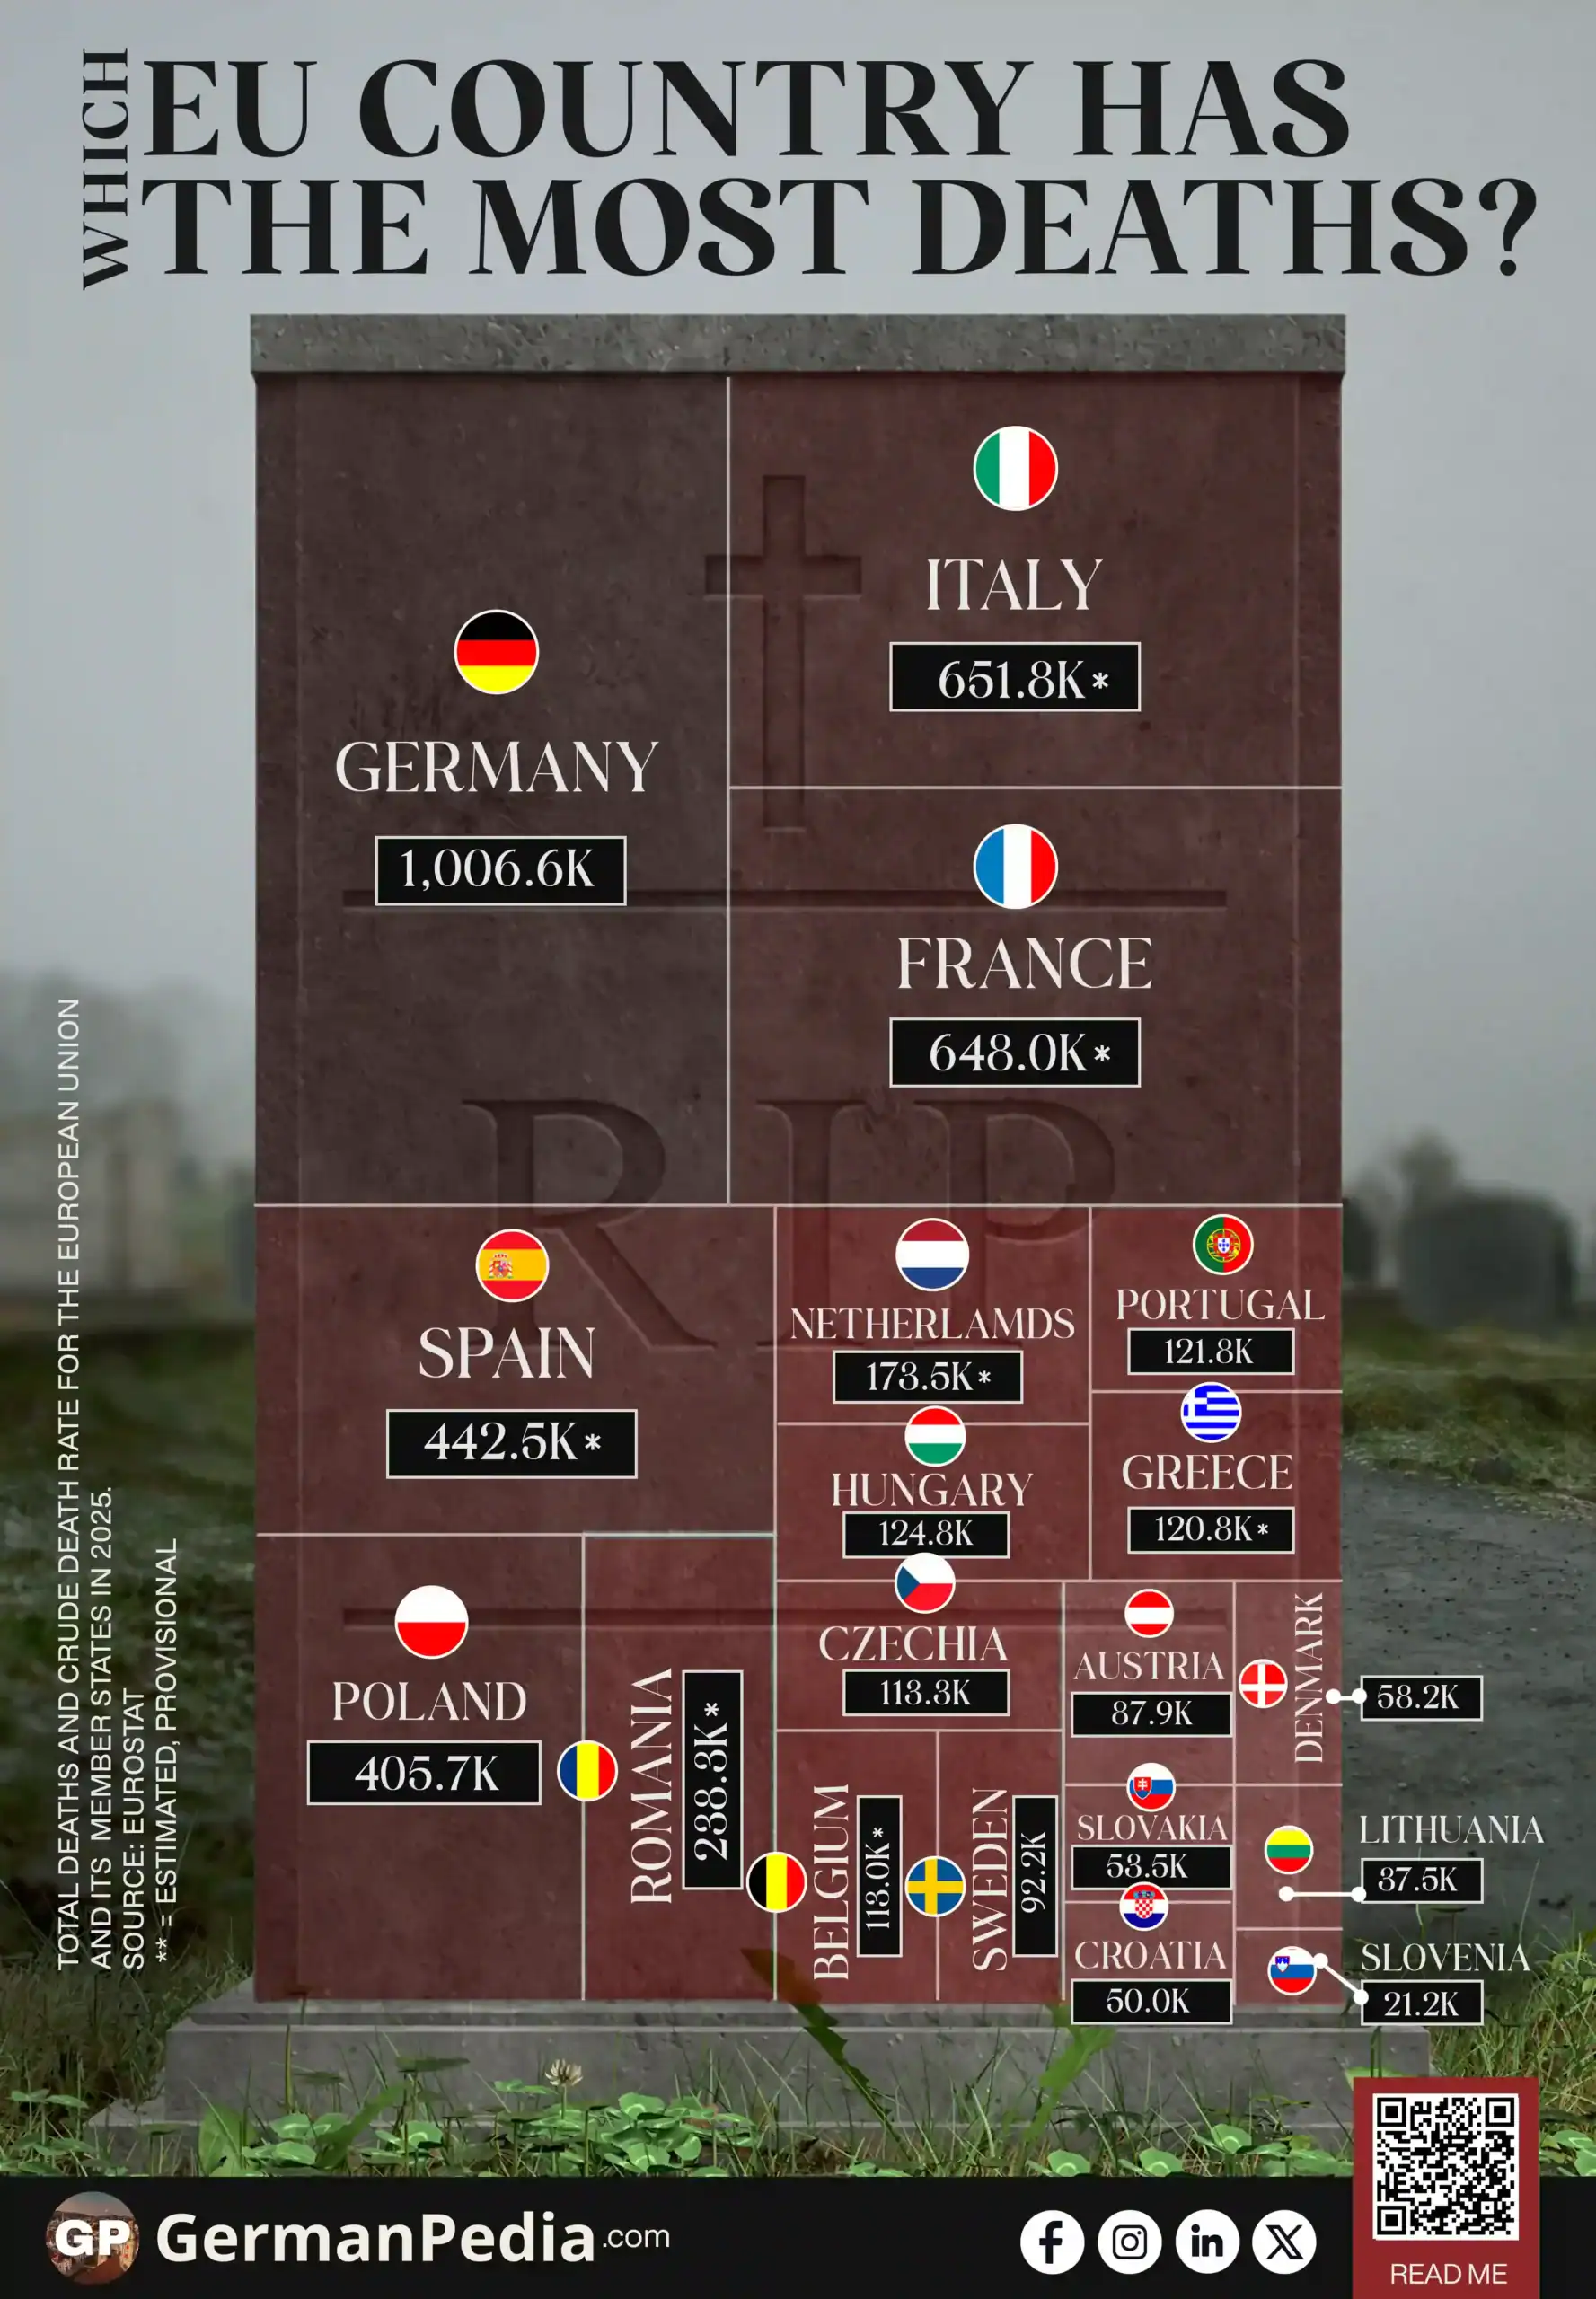
Use this Visualization: You may use this image for free with proper attribution to GermanPedia (i.e., by linking back to GermanPedia).
Need help communicating complex ideas visually? We help you turn data into your most persuasive story. Contact us to learn more.
Total Deaths and Crude Death Rate in EU Countries
| Country | Deaths (in thousands) | Crude Death Rate (per 1,000) |
|---|---|---|
| European Union | 4,812.4* | 10.7** |
| Bulgaria | 99.5 | 15.5 |
| Latvia | 26.1 | 14.1 |
| Hungary | 124.8 | 13.1 |
| Lithuania | 37.5 | 13.0 |
| Croatia | 50.0 | 12.9 |
| Romania | 238.3* | 12.5** |
| Germany | 1,006.6 | 12.1 |
| Greece | 120.8* | 11.7** |
| Estonia | 15.7 | 11.5 |
| Italy | 651.8* | 11.1* |
| Poland | 405.7 | 11.1 |
| Portugal | 121.8 | 10.7 |
| Finland | 59.2 | 10.5 |
| Czechia | 113.3 | 10.4 |
| Slovenia | 21.2 | 9.9 |
| Slovakia | 53.5 | 9.9 |
| Denmark | 58.2 | 9.7 |
| Netherlands | 173.5* | 9.6* |
| Belgium | 113.0* | 9.5* |
| Austria | 87.9 | 9.5 |
| France | 648.0* | 9.4* |
| Spain | 442.5* | 9.0* |
| Sweden | 92.2 | 8.7 |
| Malta | 4.2 | 7.3 |
| Cyprus | 6.8* | 6.9* |
| Ireland | 35.6 | 6.5 |
| Luxembourg | 4.4 | 6.4 |
Source: Eurostat
Crude death rate is deaths per 1,000 inhabitants.
* = provisional ** = estimated, provisional

The EU recorded 4,812,382 deaths in 2025. Its crude death rate stood at 10.7 deaths per 1,000 people. That rate measures deaths against total population. It is a way to compare mortality across countries of different sizes.
Leading Causes of Death in the EU ->
The EU average hides a wide gap between countries. Bulgaria’s death rate reaches 15.5 per 1,000. Luxembourg’s reaches 6.4.
Bulgaria’s Death Rate Is 4.8 Points Above the EU Average
Bulgaria posts the highest crude death rate in the EU. It reaches 15.5 deaths per 1,000 people. That is 4.8 points above the EU average of 10.7. Bulgaria also has one of the EU’s oldest populations. Residents aged 65 and over make up 24.0% of the population. That is the third-highest share in the EU.
Five more countries post death rates well above the EU average:
- Latvia: 14.1 per 1,000
- Hungary: 13.1 per 1,000
- Lithuania: 13.0 per 1,000
- Croatia: 12.9 per 1,000
- Romania: 12.5 per 1,000
Luxembourg, Ireland, and Cyprus Have the EU’s Youngest Populations and Lowest Death Rates
Luxembourg, Ireland, and Cyprus post the lowest death rates in the EU:
- Luxembourg: 6.4 per 1,000
- Ireland: 6.5 per 1,000
- Cyprus: 6.9 per 1,000
Luxembourg, Ireland, and Cyprus also have the smallest shares of people aged 65 and over in the EU. Luxembourg’s older population share stands at 15.2%. Ireland’s stands at 15.7%. Cyprus’s stands at 18.3%. Ireland also has the EU’s lowest median age. It stands at 39.6 years, against an EU-wide median of 44.9.
Germany Records the Most Deaths in the EU, But Not the Highest Rate
Germany recorded 1,006,588 deaths in 2025. That is more than any other EU country. It is the only EU country to pass 1 million deaths in a single year. Germany’s death count reflects its population size. It is the EU’s most populous country.
Leading Causes of Death in Germany ->
Germany’s crude death rate tells a different story. It ranks 7th highest in the EU. It reaches 12.1 per 1,000. That is above the EU average of 10.7. It remains far below Bulgaria’s 15.5. Raw death counts largely track population size. The crude death rate strips that effect out. It shows how mortality actually compares across countries of different sizes.
The pattern across the EU is consistent. Countries with older populations, like Bulgaria, record the highest death rates. Countries with younger populations, like Luxembourg and Ireland, record the lowest. Population size drives the raw number of deaths a country records each year. Population age structure drives how that number compares once adjusted for size.
More topics
- Top 10 Leading Causes of Death in the EU
- Leading Causes of Death in Germany
- Causes of Death in Germany By Gender
- How Birth Rates Dropped and Deaths Rose in Germany
- Foreign-Born Population in the EU Is Rising
- German Population Growth Between 1997 and 2025
- Which EU Country Has the Most Healthy Life Years?
- Which EU Country Recycles the Most?
- Top 10 Leading Causes of Death in the EU
- GDP per Capita vs Actual Consumption per Capita in the EU
- Which Country Owns Almost a Quarter of the EU’s Wealth?
- Most Popular Degree Programs in Germany
- Which are the toughest prisons in the EU?
- Which EU Countries Had the Highest Inflation Rates?
- EU Fertility Rate by Country