Key Takeaways
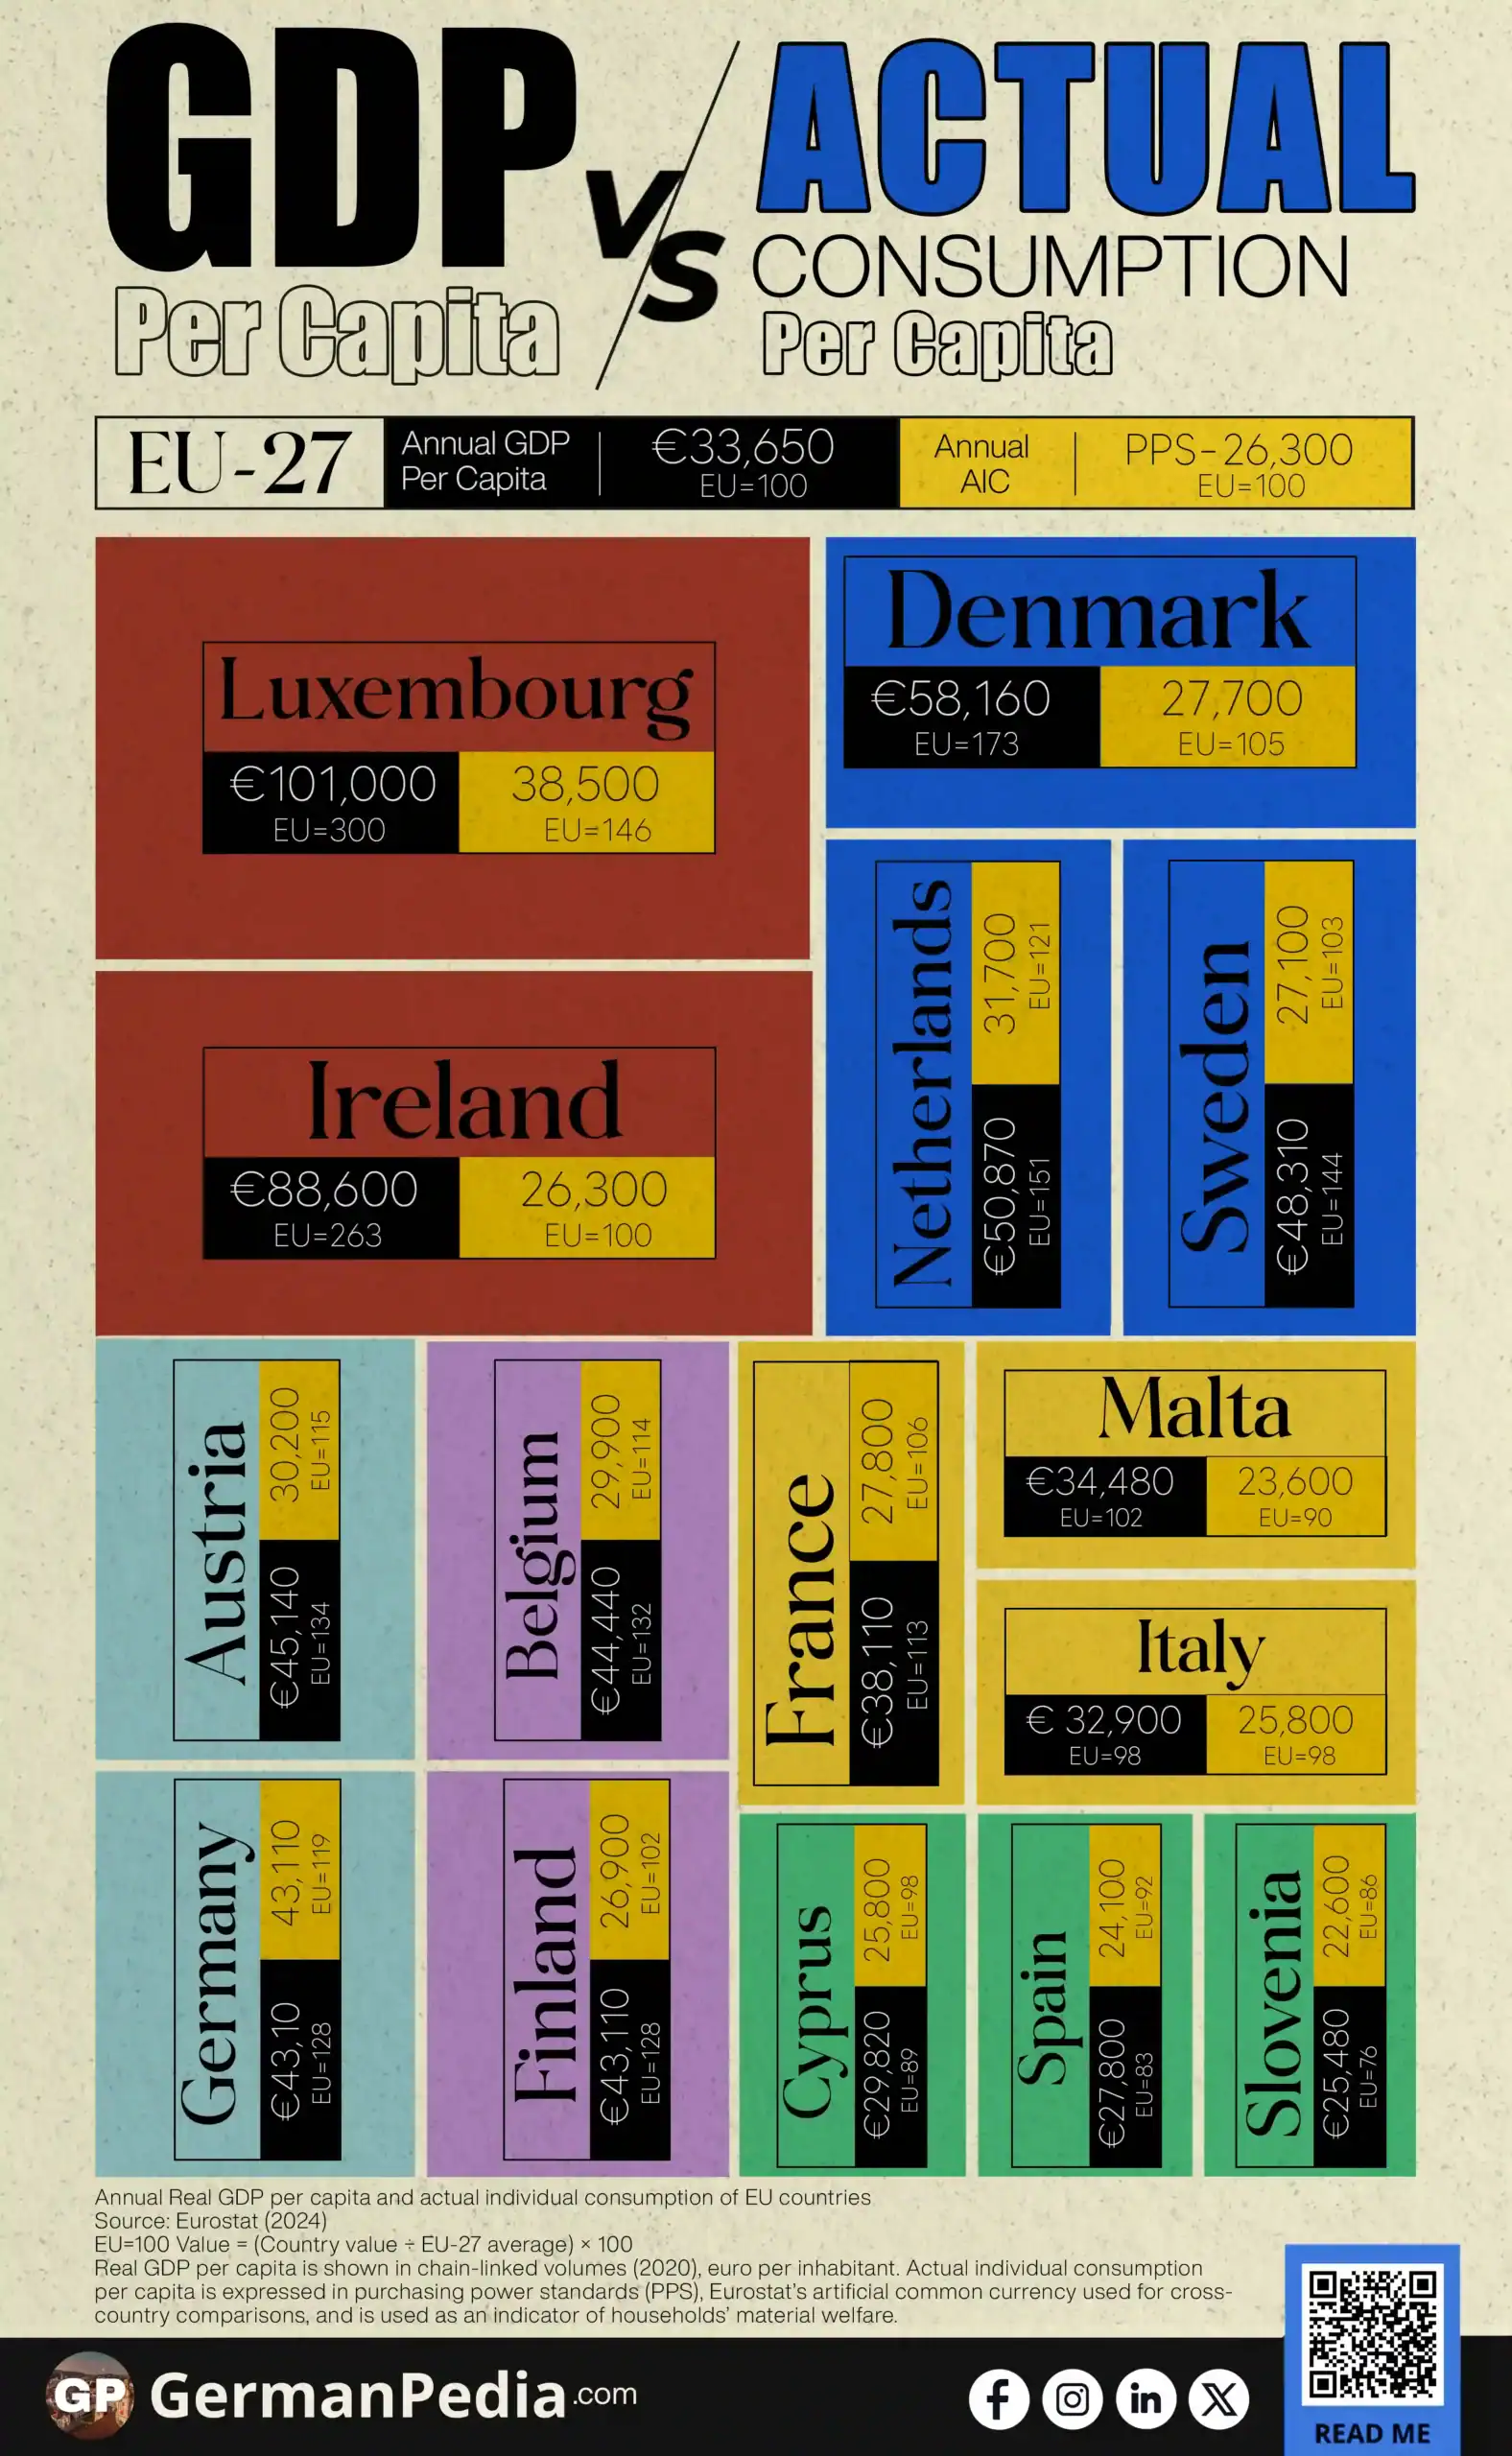
- Luxembourg leads both output and consumption, but not equally. GDP per capita (€101,000) is inflated by cross-border workers, while consumption (38,500 PPS) is much less extreme.
- Ireland’s GDP per capita overstates what households experience due to multinational profits recorded locally.
- Germany shows a more direct link between output and consumption. With GDP at 128 and AIC at 119 (EU=100), a strong domestic economy supports household consumption.
- Poland and Romania outperform their GDP rankings in consumption. Lower price levels and EU economic convergence make their incomes go much further, narrowing consumption gaps.
- Some countries remain below average even after adjustment. Bulgaria and Hungary lag due to lower productivity and wages.
- GDP gaps exceed consumption gaps. The EU looks less unequal by what people actually consume.
Use this Visualization: You may use this image for free with proper attribution to GermanPedia (i.e., by linking back to GermanPedia).
Need help communicating complex ideas visually? We help you turn data into your most persuasive story. Contact us to learn more.
GDP per capita measures economic output per person. Higher numbers usually signal a “richer” country.
But GDP has limits. It shows production, not daily life.
Actual Individual Consumption (AIC) fills this gap. It tracks what people really use:
- Goods they buy
- Services they receive
- Government-provided items like healthcare and education
So a useful way to think about it is:
- GDP per capita → what the country produces per person
- AIC per capita → what each person consumes
Together, they give the full picture of living standards.
EU Countries’ GDP and Actual Individual Consumption per Capita
| Country | Annual GDP Per Capita | Annual AIC | ||
|---|---|---|---|---|
| € per capita | EU=100 | PPS | EU=100 | |
| EU-27 | 33,650 | 100 | 26,300 | 100 |
| Luxembourg | 101,000 | 300 | 38,500 | 146 |
| Ireland | 88,600 | 263 | 26,300 | 100 |
| Denmark | 58,160 | 173 | 27,700 | 105 |
| Netherlands | 50,870 | 151 | 31,700 | 121 |
| Sweden | 48,310 | 144 | 27,100 | 103 |
| Austria | 45,140 | 134 | 30,200 | 115 |
| Belgium | 44,440 | 132 | 29,900 | 114 |
| Germany | 43,110 | 128 | 31,400 | 119 |
| Finland | 43,110 | 128 | 26,900 | 102 |
| France | 38,110 | 113 | 27,800 | 106 |
| Malta | 34,480 | 102 | 23,600 | 90 |
| Italy | 32,900 | 98 | 25,800 | 98 |
| Cyprus | 29,820 | 89 | 25,800 | 98 |
| Spain | 27,800 | 83 | 24,100 | 92 |
| Slovenia | 25,480 | 76 | 22,600 | 86 |
| Portugal | 22,370 | 66 | 22,600 | 86 |
| Czechia | 21,920 | 65 | 21,500 | 82 |
| Estonia | 21,060 | 63 | 19,600 | 75 |
| Lithuania | 19,690 | 59 | 23,200 | 88 |
| Slovakia | 19,110 | 57 | 20,400 | 78 |
| Greece | 19,020 | 57 | 20,900 | 80 |
| Croatia | 17,060 | 51 | 20,800 | 79 |
| Latvia | 16,910 | 50 | 19,000 | 72 |
| Poland | 16,470 | 49 | 22,300 | 85 |
| Hungary | 16,210 | 48 | 19,100 | 73 |
| Romania | 13,090 | 39 | 22,600 | 86 |
| Bulgaria | 11,330 | 34 | 19,200 | 73 |
Source: Eurostat (2024)
EU=100 Value = (Country value ÷ EU-27 average) × 100
Real GDP per capita is shown in chain-linked volumes (2020), euro per inhabitant. Actual individual consumption per capita is expressed in purchasing power standards (PPS), Eurostat’s artificial common currency used for cross-country comparisons, and is used as an indicator of households’ material welfare.

Luxembourg and Ireland stand out on top of the list, but they tell very different stories.
Luxembourg is the only country that sits firmly at the top in both output and consumption. However, the gap between those two numbers is important.
- GDP per capita: €101,000
- AIC per capita: 38,500 PPS
Its GDP per capita is extremely high, while consumption is also high but much less extreme.
Many cross-border workers contribute to Luxembourg’s output, which raises GDP per capita, but some of the income generated is spent in other countries where they live.
Luxembourg also has a strong concentration of financial and business services, which supports high output.
Meanwhile, Ireland shows how individual GDP and consumption can diverge.
- GDP per capita: €88,600
- AIC per capita: 26,300 PPS (EU average = 100)
Ireland appears among Europe’s richest countries by GDP per capita. Actual individual consumption, however, sits much closer to the EU average.
Ireland hosts many multinational companies. They record big profits and intellectual property there, which boosts GDP significantly. But that money doesn’t fully reach Irish households or get spent in Ireland.
After these outliers, most EU countries follow a more predictable pattern where GDP per capita and actual consumption move more closely together.
Its GDP per capita (EU Ave. = 128) and AIC per capita (EU Ave. = 119) both sit comfortably above average, without extreme divergence
Germany’s large domestic economy means economic output more directly supports household consumption, unlike countries heavily influenced by multinational profit flows.
Germany’s GDP growth over time ->
Further down the ranking, some countries appear much lower on GDP but closer to the EU average in consumption. This includes:
- Poland (€16,470 GDP per capita | 22,300 PPS AIC)
- Romania (€13,090 | 22,600 PPS)
This is mainly due to:
- Lower price levels mean income buys more. Poland (EU Ave. = 72) and Romania (EU Ave. = 64) have significantly cheaper goods and services.
- Economic convergence within the EU. Both countries have seen rapid gains in incomes and consumption over the past decade.
AIC gaps are smaller than GDP gaps because PPS fixes price differences between countries. Even with a lower GDP, people in these countries can consume almost as much as the EU average because everything costs less.
At the lower end, some countries remain below the EU average on both measures, such as
- Bulgaria (€11,330 GDP per capita | 19,200 PPS AIC)
- Hungary (€16,210 | 19,100 PPS)
- Greece (€19,020 | 20,900 PPS)
Lower productivity, wages, and concentration in lower-value industries limit both economic output and household purchasing power.
Three factors explain these patterns across EU countries:
- Where economic activity is recorded (multinationals in Ireland, financial hubs in Luxembourg)
- Who is counted in the population (Luxembourg’s cross-border workforce)
- How far income goes (lower prices in Poland and Romania)
GDP per capita shows large gaps between countries, while actual consumption shows smaller differences. Price levels, economic structure, and how output reaches households all matter. The EU looks less unequal when you measure what people actually consume rather than what economies produce.
More topics
- GDP of European Countries
- Top 10 Biggest EU Companies Led by Women
- Top 13 Most Valuable Brands in the EU
- Where are Billionaires Concentrated in the EU?
- Employment by Federal State in Germany
- Germany’s Median Wage by Federal State
- Germany’s Top 8 Most Valuable Brands
- Which Federal States Drive Germany’s Economy?
- EU Unicorn Startups: Which Countries Lead and Why
- Employment in the EU Is Shifting Toward Higher Education
- Women Are Increasing in Managerial Roles Across the EU
- Top 10 Richest Women in the EU
- EU Alternatives to Common US Platforms
- Which Countries Use AI the Most in the EU?
- Top EU Countries Where People Say They Don’t Need AI
- Happiness vs Income in the EU
References
- https://ec.europa.eu/eurostat/databrowser/view/sdg_08_10/default/table?lang=en
- https://ec.europa.eu/eurostat/databrowser/view/prc_ppp_ind_1__custom_20885752/default/table
- https://ec.europa.eu/eurostat/web/products-eurostat-news/-/ddn-20211215-1
- https://www.ecb.europa.eu/press/economic-bulletin/focus/2023/html/ecb.ebbox202303_02~3404c284d0.en.html
- https://ec.europa.eu/eurostat/statistics-explained/index.php?
- https://www.thediplomat.ro/2025/09/11/romanias-economic-convergence-in-the-european-context-theoretical-considerations-and-empirical-evidence/