Key Takeaways
- Germany’s baby boom in the 1950s and 1960s led to high birth rates that sharply declined starting in 1972.
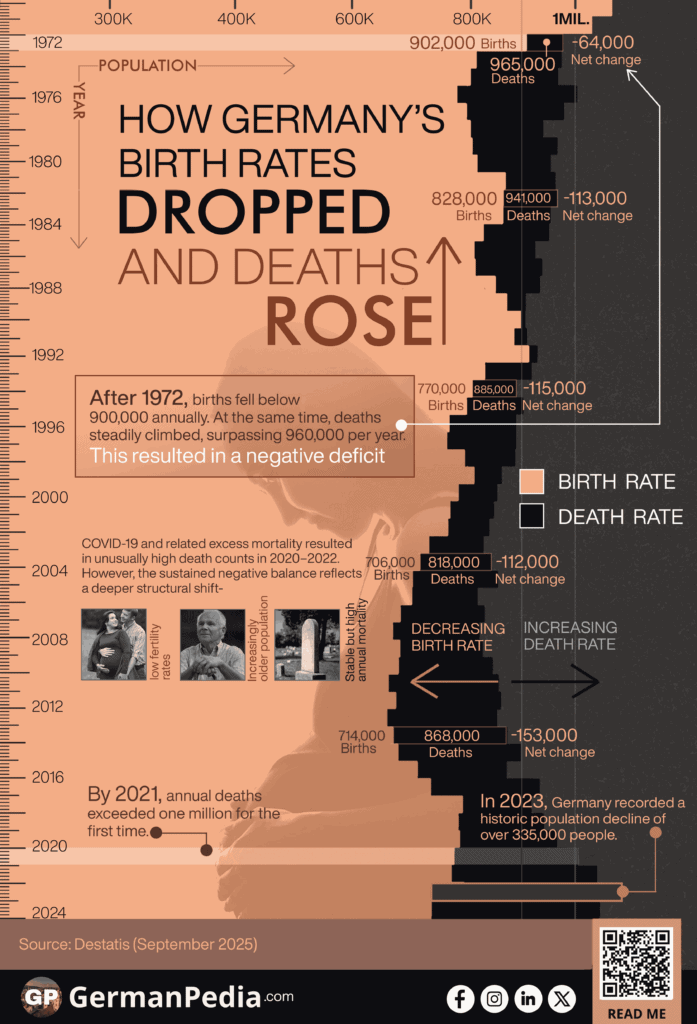
- Since 1972, deaths have outnumbered births annually. This led to a natural population decline that has grown over time. By 2021, annual deaths exceeded one million for the first time.
- Falling birth rates result from changing family norms, increased women’s education and workforce participation, and widespread access to modern contraception.
- COVID-19 contributed to excess deaths from 2020 to 2022. However, long-term trends like low fertility and an aging population primarily drive population decline.
- In 2023, Germany recorded its largest population decrease on record, with over 335,000 fewer people.
Use this Visualization: You may use this image for free with proper attribution to GermanPedia (i.e., by linking back to GermanPedia).
Number of Live Births & Deaths in Germany
| Year | Live births | Deaths | Net change | ||||
|---|---|---|---|---|---|---|---|
| Total | Change (in %) | per 1,000 residents | Total | Change (in %) | per 1,000 residents | ||
| 2024 | 677,117 | -2.28% | 8.1 | 1,007,758 | -2.00% | 12.1 | -330,641 |
| 2023 | 692,989 | -6.21% | 8.3 | 1,028,206 | -3.58% | 12.3 | -335,217 |
| 2022 | 738,819 | -6.82% | 9 | 1,066,341 | 4.17% | 12.9 | -327,522 |
| 2021 | 795,492 | 2.88% | 9.6 | 1,023,687 | 3.99% | 12.3 | -228,195 |
| 2020 | 773,144 | -0.63% | 9.3 | 985,572 | 4.91% | 11.8 | -212,428 |
| 2019 | 778,090 | -1.34% | 9.4 | 939,520 | -1.60% | 11.3 | -161,430 |
| 2018 | 787,523 | 0.33% | 9.5 | 954,874 | 2.42% | 11.5 | -167,351 |
| 2017 | 784,901 | -0.92% | 9.5 | 932,272 | 2.35% | 11.3 | -147,371 |
| 2016 | 792,141 | 7.40% | 9.6 | 910,902 | -1.51% | 11 | -118,761 |
| 2015 | 737,575 | 3.17% | 9 | 925,200 | 6.55% | 11.3 | -187,625 |
| 2014 | 714,927 | 4.81% | 8.8 | 868,356 | -2.85% | 10.7 | -153,429 |
| 2013 | 682,069 | -2.16% | 8.5 | 893,825 | 2.78% | 11.1 | -211,756 |
| 2012 | 673,544 | -1.57% | 8.4 | 869,582 | 2.01% | 10.8 | -196,038 |
| 2011 | 662,685 | -2.25% | 8.3 | 852,328 | -0.71% | 10.6 | -189,643 |
| 2010 | 677,947 | 1.94% | 8.3 | 858,768 | 0.50% | 10.5 | -180,821 |
| 2009 | 665,126 | -2.56% | 8.1 | 854,544 | 1.19% | 10.4 | -189,418 |
| 2008 | 682,514 | -0.34% | 8.3 | 844,439 | -1.52% | 10.3 | -161,925 |
| 2007 | 684,862 | 1.81% | 8.3 | 827,155 | -2.23% | 10.1 | -142,293 |
| 2006 | 672,724 | -1.91% | 8.2 | 821,627 | -1.29% | 10 | -148,903 |
| 2005 | 685,795 | -2.80% | 8.3 | 830,227 | 1.46% | 10.1 | -144,432 |
| 2004 | 705,622 | -1.91% | 8.5 | 818,271 | -4.20% | 9.9 | -112,649 |
| 2003 | 706,721 | -1.71% | 8.6 | 853,946 | 1.46% | 10.3 | -147,225 |
| 2002 | 719,250 | -2.13% | 8.7 | 841,686 | -1.57% | 10.2 | -122,436 |
| 2001 | 734,475 | -4.19% | 8.9 | 828,541 | -1.19% | 10.1 | -94,066 |
| 2000 | 766,999 | -0.83% | 9.3 | 838,797 | -0.95% | 10.2 | -71,798 |
| 1999 | 770,744 | -1.82% | 9.4 | 846,330 | -0.61% | 10.3 | -75,586 |
| 1998 | 785,034 | -3.58% | 9.6 | 852,382 | -0.31% | 10.4 | -67,348 |
| 1997 | 812,173 | 2.27% | 9.9 | 860,389 | -1.77% | 10.5 | -48,216 |
| 1996 | 796,013 | 4.01% | 9.7 | 882,843 | -0.20% | 10.8 | -86,830 |
| 1995 | 765,221 | -0.57% | 9.4 | 884,588 | -0.01% | 10.8 | -119,367 |
| 1994 | 769,603 | -3.53% | 9.5 | 884,661 | -1.43% | 10.9 | -115,058 |
| 1993 | 798,447 | -1.40% | 9.8 | 897,270 | 1.34% | 11.1 | -98,823 |
| 1992 | 809,114 | -2.64% | 10 | 885,443 | -2.29% | 11 | -76,329 |
| 1991 | 830,019 | -8.12% | 10.4 | 911,245 | -1.08% | 11.4 | -81,226 |
| 1990 | 905,675 | 2.86% | 11.4 | 921,445 | 2.06% | 11.6 | -15,770 |
| 1989 | 880,459 | -1.41% | 11.2 | 903,441 | 2.53% | 11.5 | -22,982 |
| 1988 | 892,993 | 2.88% | 11.4 | 900,627 | -0.07% | 11.5 | -7,634 |
| 1987 | 867,969 | -2.82% | 11.2 | 901,291 | 2.28% | 11.6 | -33,322 |
| 1986 | 848,232 | 4.20% | 10.9 | 925,426 | 0.52% | 11.9 | -77,194 |
| 1985 | 813,803 | 0.19% | 10.5 | 929,649 | 1.35% | 12 | -115,846 |
| 1984 | 812,292 | -1.89% | 10.4 | 917,299 | -2.53% | 11.8 | -105,007 |
| 1983 | 827,933 | -3.91% | 10.6 | 941,032 | -0.24% | 12.1 | -113,099 |
| 1982 | 861,275 | -0.10% | 11 | 943,832 | -1.33% | 12.1 | -82,557 |
| 1981 | 862,100 | -0.27% | 11 | 954,436 | 0.22% | 12.2 | -92,336 |
| 1980 | 865,789 | 6.24% | 11 | 952,371 | -0.83% | 12.1 | -86,582 |
| 1979 | 817,217 | 1.06% | 10.5 | 944,474 | -1.58% | 12.1 | -127,257 |
| 1978 | 808,619 | 0.39% | 10.4 | 955,550 | 2.62% | 12.2 | -146,931 |
| 1977 | 805,496 | 0.90% | 10.3 | 931,155 | -3.03% | 11.9 | -125,659 |
| 1976 | 798,334 | 2.06% | 10.2 | 966,873 | -2.27% | 12.3 | -168,539 |
| 1975 | 782,310 | -2.89% | 9.9 | 989,649 | 3.46% | 12.6 | -207,339 |
| 1974 | 805,500 | -1.29% | 10.2 | 956,573 | -0.59% | 12.1 | -151,073 |
| 1973 | 815,969 | -9.50% | 10.3 | 962,988 | -0.28% | 12.2 | -147,019 |
| 1972 | 901,657 | -11.03% | 11.4 | 965,689 | 0.01% | 12.2 | -64,032 |
| 1971 | 1,013,396 | -3.33% | 12.9 | 965,623 | -1.03% | 12.3 | 47,773 |
| 1970 | 1,047,737 | 13.5 | 975,664 | 12.6 | 72,073 | ||

In the decades after World War II, Germany saw consistently high birth rates, especially during the baby boom years (1950s-1960s). Starting in 1972, births fell below 900,000 annually. At the same time, deaths steadily climbed, surpassing 960,000 per year. This resulted in a negative deficit in 1972. It means that more people die each year than are born.
Several factors triggered the sharp drop in births around 1972:
- Shifting Family Norms: Couples began choosing smaller families, prioritizing personal lifestyles over larger households.
- Women’s Education and Employment: Longer education and higher workforce participation delayed marriage and motherhood.
- Reliable Contraception: Widespread access to modern birth control, especially the pill, made it easier to avoid unplanned pregnancies and to limit family size.
The gap has widened sharply in recent years. By 2021, annual deaths exceeded one million for the first time. In 2023, Germany recorded a historic population decline of over 335,000 people.
COVID‑19 and related excess mortality contributed to the unusually high death counts in 2020–2022. However, the sustained negative balance reflects a deeper structural shift:
- low fertility rates
- an increasingly older population
- stable but high annual mortality
Life Expectancy and the Aging Effect in Germany
Destatis data shows that people in Germany are living longer than in previous generations. In the 2022/24 period, boys can expect to live 78.5 years, while girls have a life expectancy of 83.2 years [1].
This steady rise over decades has expanded the share of older adults within the population, a key driver behind the increasing number of annual deaths. Combined with historically low birth rates, Germany faces a structural, long-term natural population decline.
The aging and declining population of Germany has also strained its social security system. It has resulted in decreasing pensions and increasing social security contributions.
The health insurance premiums are also increasing steadily. Without any systemic change, the German social system may collapse.
More topics
- Highest Paying Jobs in Germany
- Popular Study Destinations for German Students
- Educational Attainment in European Countries
- Grocery Prices in Germany Have Increased Since 2000
- Germany’s Smoking Rate Has Declined Over Two Decades
- Germany’s Electricity Mix: From Coal to Renewables
- Changes in Harvest of Germany’s Five Key Crops
- Top German Companies by Revenue
- Germany’s Top Car Brands by New Registrations
- Unemployment Across Germany: A Federal State Breakdown
- Where Germany’s Tourists Come From
- Germany’s Largest National Parks, Ranked by Size
- Which Federal States Drive Germany’s Economy?
- How Marriage Rates Have Fallen in Germany: 1990–2023
- Leading Causes of Death in Germany
References
- https://www.uni-siegen.de/en/news/between-revolution-and-risk-65-years-of-the-contraceptive-pill
- https://www.destatis.de/DE/Themen/Gesellschaft-Umwelt/Bevoelkerung/Sterbefaelle-Lebenserwartung/_inhalt.html?
- https://www.destatis.de/EN/Themes/Society-Environment/Population/Births/Tables/lrbev04.html#242410