Key Takeaways
- Germany recycled 68.7% of its waste in 2023. It is the highest rate in the EU. This is driven by a deposit system for bottles and required sorting at home.
- Latvia, Slovakia, and Lithuania each gained more than 40 percentage points since 2007. These are the largest increases in the EU.
- Some countries recycle less than in 2007. That includes Belgium, Sweden, and Bulgaria.
- EU recycling rates come down to whether a country has built the right waste systems, not just people’s habits.
- Eighteen EU countries are not on track to hit the EU’s goal of recycling 55% of waste by 2025.
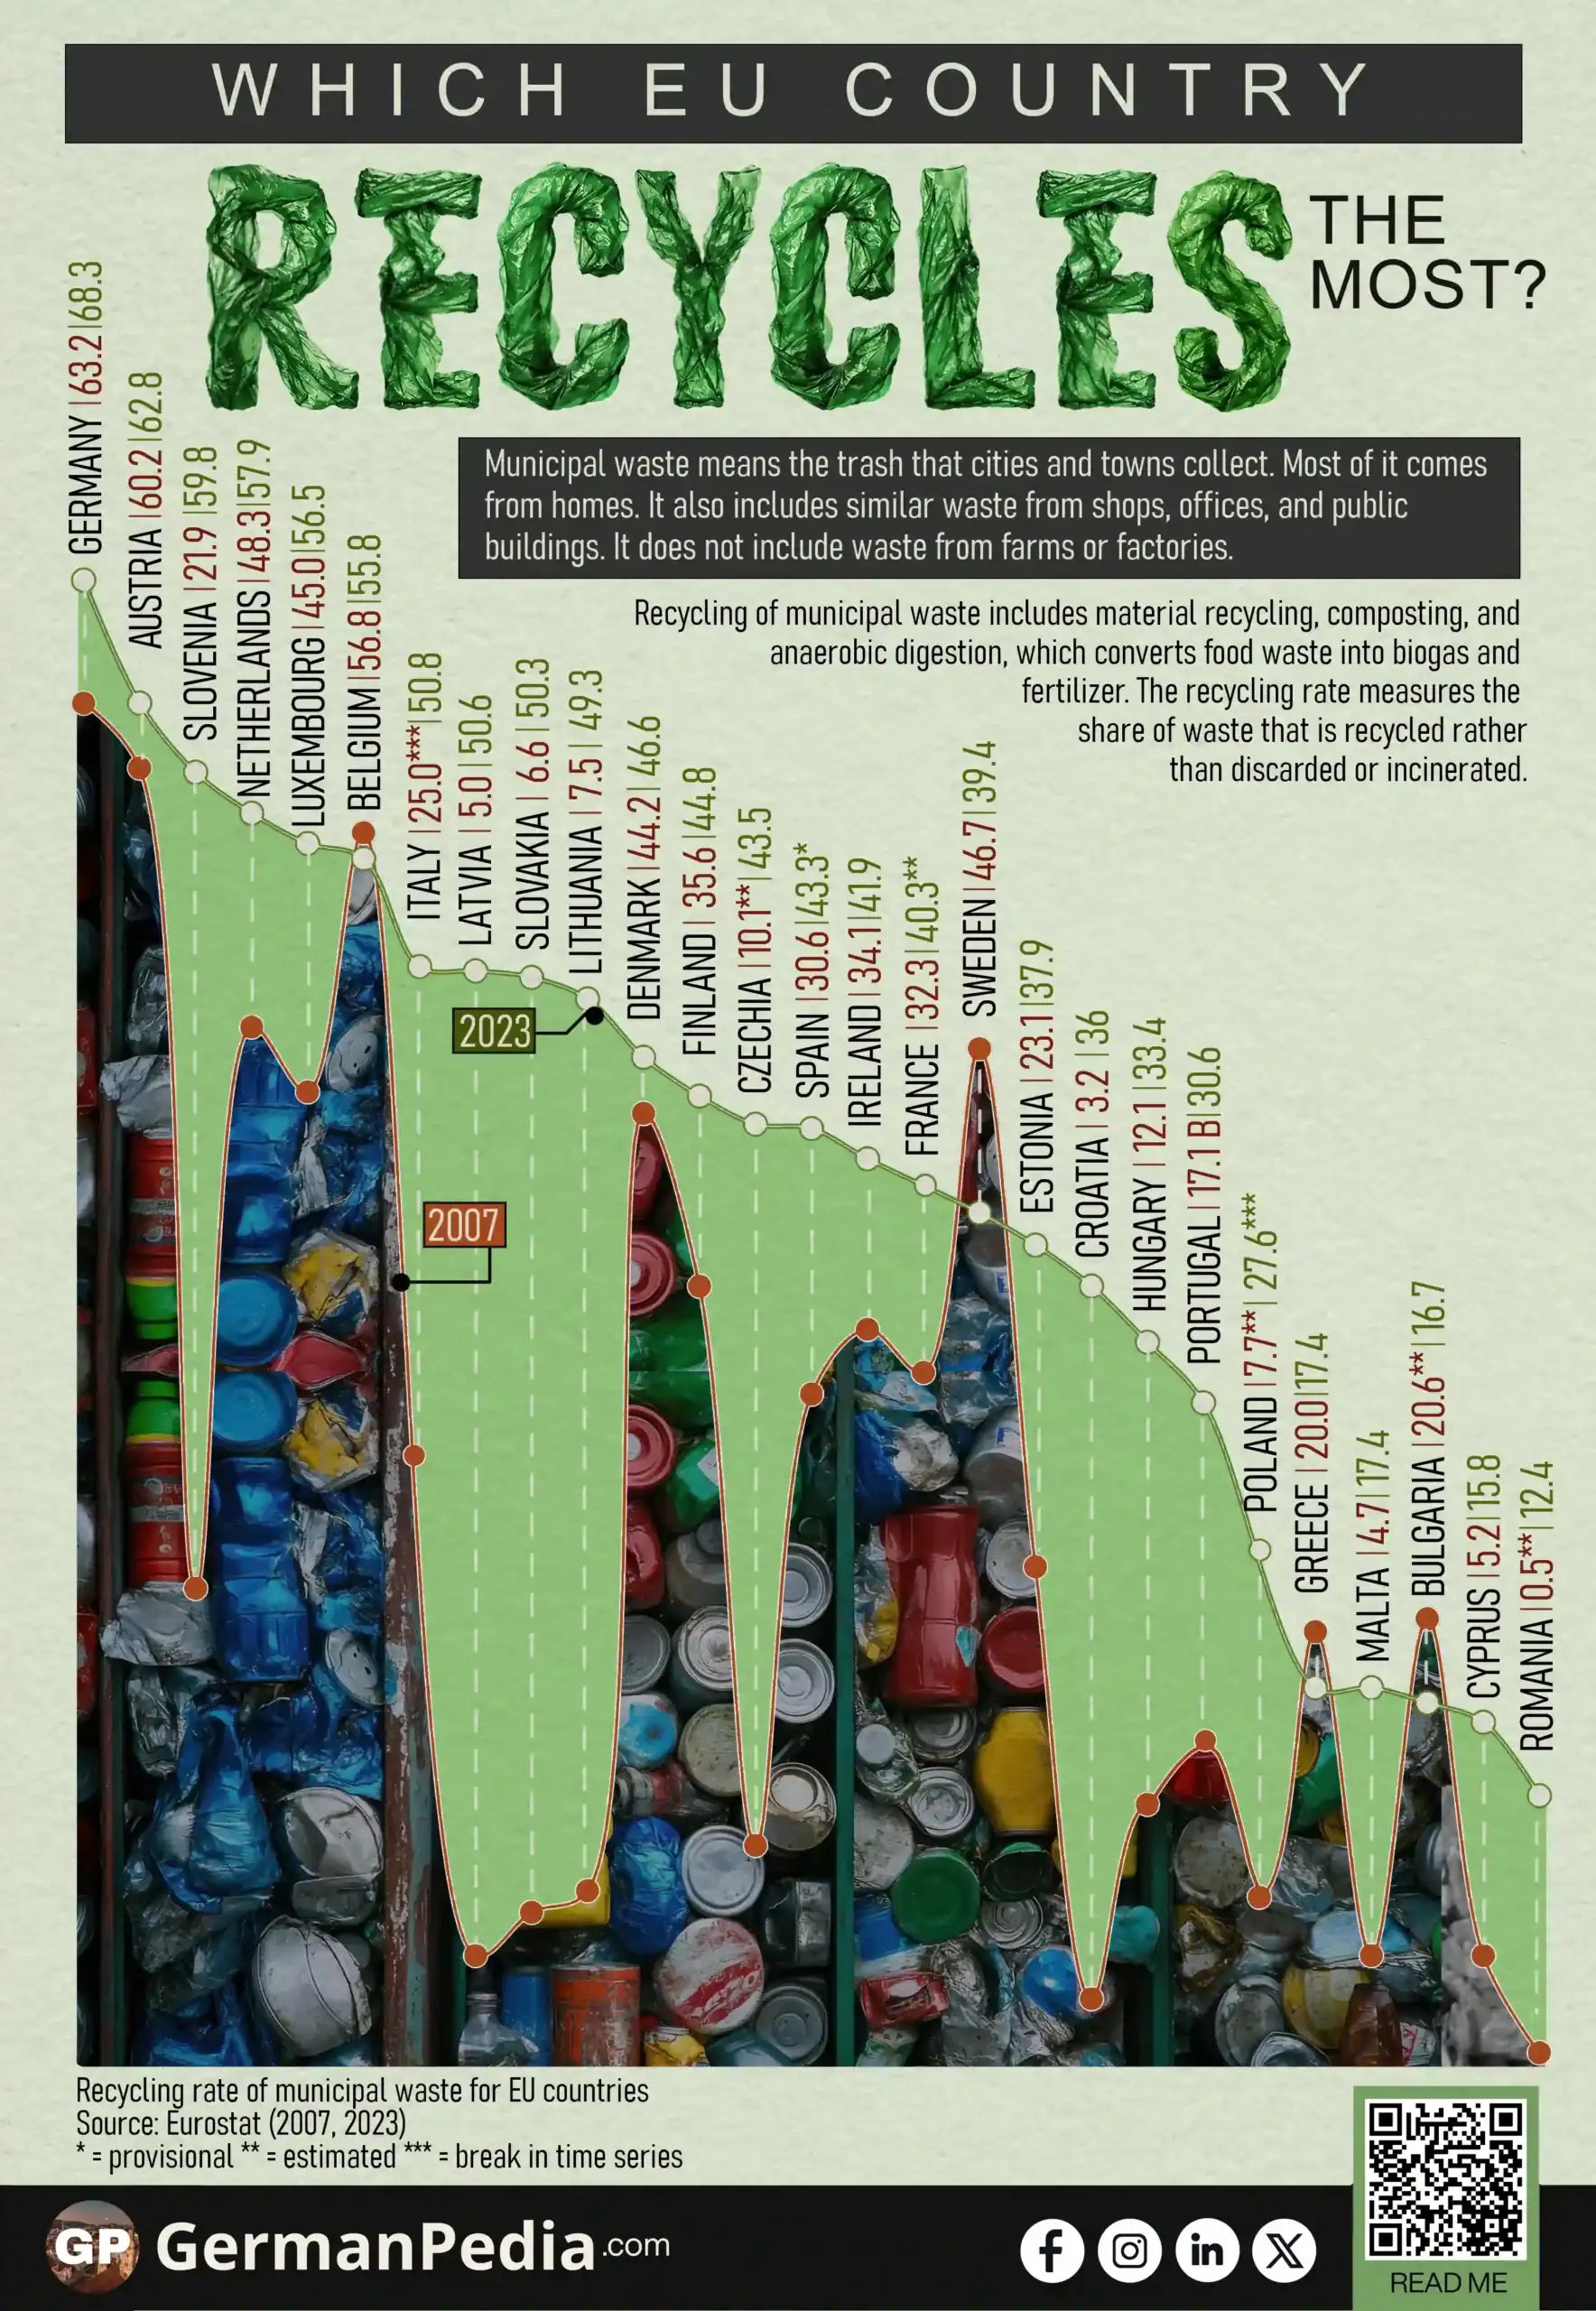
Use this Visualization: You may use this image for free with proper attribution to GermanPedia (i.e., by linking back to GermanPedia).
Need help communicating complex ideas visually? We help you turn data into your most persuasive story. Contact us to learn more.
Municipal Waste Recycling Rate Change Across EU Countries
| Country | Municipal Waste Recycling Rate (In %) | ||
|---|---|---|---|
| 2007 | 2023 | Change (pp) | |
| Germany | 63.2 | 68.7 | +5.5 |
| Austria | 60.2 | 62.8 | +2.6 |
| Slovenia | 21.9 | 59.8 | +37.9 |
| Netherlands | 48.3 | 57.9 | +9.6 |
| Luxembourg | 45.0 | 56.5 | +11.5 |
| Belgium | 56.8 | 55.8 | -1.0 |
| Italy | 25.0*** | 50.8 | +25.8 |
| Latvia | 5.0 | 50.6 | +45.6 |
| Slovakia | 6.6 | 50.3 | +43.7 |
| Lithuania | 7.5 | 49.3 | +41.8 |
| Denmark | 44.2 | 46.6 | +2.4 |
| Finland | 35.6 | 44.8 | +9.2 |
| Czechia | 10.1** | 43.5 | +33.4 |
| Spain | 30.6 | 43.3* | +12.7 |
| Ireland | 34.1 | 41.9 | +7.8 |
| France | 32.3 | 40.3** | +8.0 |
| Sweden | 46.7 | 39.4 | -7.3 |
| Estonia | 23.1 | 37.9 | +14.8 |
| Croatia | 3.2 | 36.0 | +32.8 |
| Hungary | 12.1 | 33.4 | +21.3 |
| Portugal | 17.1 b | 30.6 | +13.5 |
| Poland | 7.7** | 27.6*** | +19.9 |
| Greece | 20.0 | 17.4 | -2.6 |
| Malta | 4.7 | 17.4 | +12.7 |
| Bulgaria | 20.6** | 16.7 | -3.9 |
| Cyprus | 5.2 | 15.8 | +10.6 |
| Romania | 0.5** | 12.4 | +11.9 |
Source: Eurostat (2007, 2023)
Municipal waste means the trash that cities and towns collect. Most of it comes from homes. It also includes similar waste from shops, offices, and public buildings. It does not include waste from farms or factories.
Recycling of municipal waste includes material recycling, composting, and anaerobic digestion. Anaerobic digestion is a process that turns food waste into biogas and fertilizer.
The rate is the share of this waste that gets recycled instead of thrown away or burned. The way this rate is calculated changed starting with data reported from 2020 onward. Several countries report lower rates as a result. This affects how earlier and later years compare for some countries.
* = provisional ** = estimated *** = break in time series

Germany Recycles More Waste Than Any Other EU Country
Germans take pride in their recycling habits. Germany recycled 68.7% of its waste in 2023. That is the highest rate in the EU. It is also up from 63.2% in 2007. That is a gain of 5.5 percentage points.
Two systems explain the lead:
- The Pfand deposit system: people pay a deposit on most bottles and cans and get the money back when they return the empty containers to a store. This encourages people to return containers instead of throwing them away.
- Color-coded sorting bins, known as Grüner Punkt or Green Dot: households sort their trash at home into separate bins for packaging, paper, glass, food and garden waste, and general trash.
Austria ranks second in the EU at 62.8%. It is the only other country above 60%.
Lithuania, Latvia, and Slovakia Made the EU’s Biggest Recycling Gains
Three countries show the sharpest change in the data:
- Latvia: 5.0% to 50.6% (+45.6 points)
- Slovakia: 6.6% to 50.3% (+43.7 points)
- Lithuania: 7.5% to 49.3% (+41.8 points)
All three moved from among the lowest recycling rates in the EU to above the EU-27 average. The EU has a fund that gives money to its poorer member countries to help them build things like roads and waste centers. This is called cohesion funding. Latvia, Slovakia, and Lithuania could apply for this money after they joined the EU in 2004. It likely helped them build the collection and sorting systems they did not have before. This is one factor behind their sharp gains in recycling rates.
Belgium and Sweden Recycle Less Than They Did in 2007
Belgium and Sweden are the clearest examples of a decline among countries that already had strong recycling systems in 2007:
- Belgium: 56.8% to 55.8% (-1.0 points)
- Sweden: 46.7% to 39.4% (-7.3 points)
Belgium sent just 0.4% of its waste to landfill in 2022, meaning almost none of it was buried in the ground. It burned 44% of that waste for energy instead of recycling it. Sweden also buries very little of its waste in landfills. Most of what Sweden does not recycle is likely burned for energy, too.
Not every country that recycles less follows this same pattern. Greece’s rate fell from 20.0% in 2007 to 17.4% in 2023. Bulgaria’s fell from 20.6% to 16.7% over the same period. Bulgaria is one of only two EU countries, along with Sweden, whose recycling rate has not gone up since 2010.
EU recycling rates come down to whether a country has built the right waste systems, not just people’s habits. An EU law called the Waste Framework Directive requires every member country to recycle 55% of its waste by 2025. Eighteen of these countries were not on track to meet that goal as of 2023. Countries that built new collection and sorting systems, like Latvia, Slovakia, and Lithuania, raised their rates fastest. Countries that did not build these systems stayed near the bottom of the ranking.
More topics
- GDP per Capita vs Actual Consumption per Capita in the EU
- EU Household Expenditure on Food and Non-Alcoholic Beverages
- EU Rent Price Index by Country Over Time
- Apartment Rents Are Rising Faster Than House Rents in Germany
- Grocery Prices in Germany [2000 – 2025]
- Which EU Countries Had the Highest Inflation Rates?
- EU Fertility Rate by Country
- Average Working Hours in EU Countries
- Gender Pay Gap Across EU Countries
- Minimum Wages Rose Fastest in Eastern Europe
- Which EU Countries Have the Highest Unemployment?
- The Best EU Countries to Retire In
- Which EU Country Uses the Most Electricity?
- Most Prosperous EU Countries by Prosperity Index
- Where are Billionaires Concentrated in the EU?
References
- https://ec.europa.eu/eurostat/databrowser/view/cei_wm011/default/table?lang=en
- https://ec.europa.eu/eurostat/statistics-explained/index.php?title=Glossary:Municipal_waste
- https://www.eea.europa.eu/en/analysis/indicators/waste-recycling-in-europe
- https://www.eea.europa.eu/en/analysis/indicators/diversion-of-waste-from-landfill
- https://www.eea.europa.eu/en/europe-environment-2025/countries/belgium/waste-generation
- https://ec.europa.eu/regional_policy/policy/themes/environment/circular_economy_en