Which EU Countries Spend the Most on Research & Development?
Key Takeaways Research and Development Investment Across EU Countries Over Time Country R&D Spending (% of GDP) Change (pp) GDP (In bn, 2023) 2003 2023 Sweden 3.58* 3.64 (19.5bn) +0.06 […]

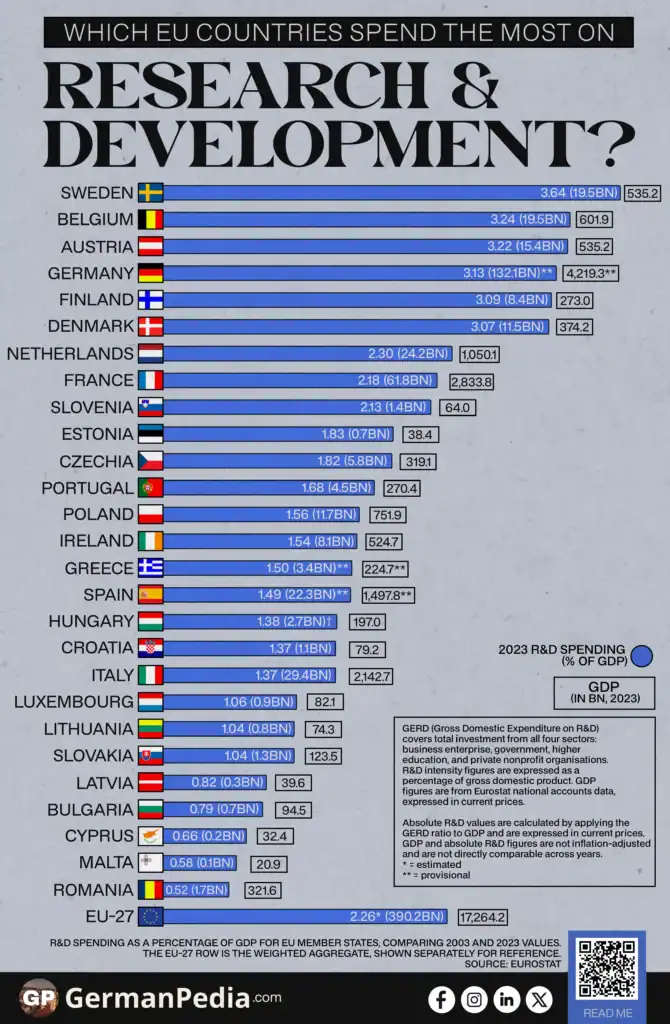
Key Takeaways Research and Development Investment Across EU Countries Over Time Country R&D Spending (% of GDP) Change (pp) GDP (In bn, 2023) 2003 2023 Sweden 3.58* 3.64 (19.5bn) +0.06 […]
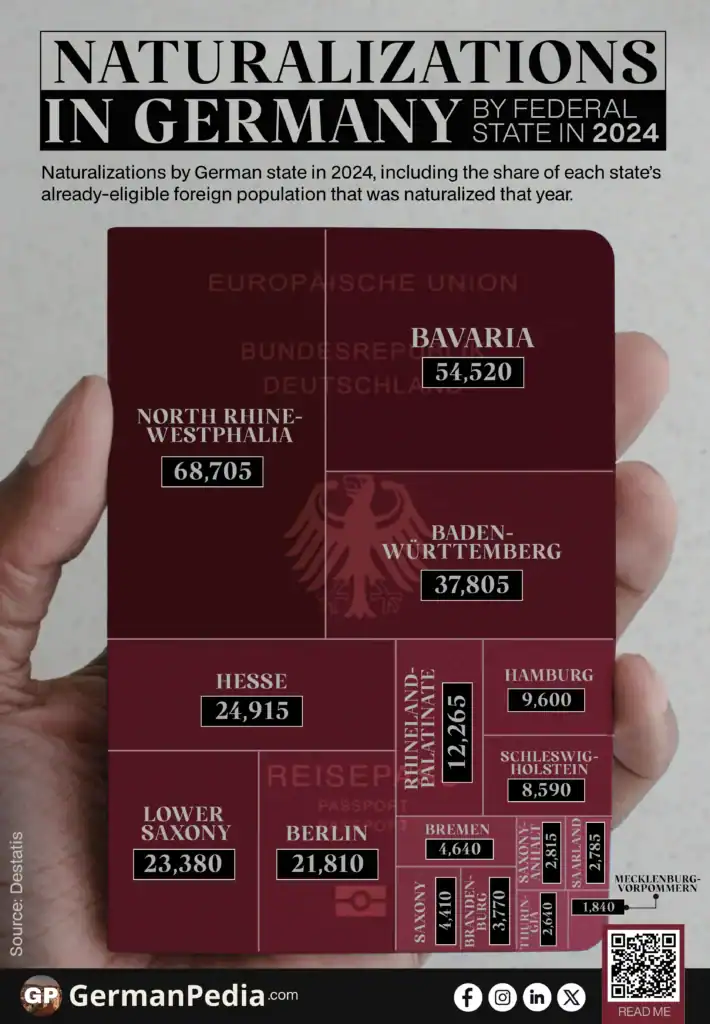
Key Takeaways German States Ranked by Naturalizations Federal State Number of Naturalizations Realized Naturalization Potential Residents of at least 10 years Residents of at least 6 years North Rhine-Westphalia 68,705

Key Takeaways The Netherlands ranks 2nd globally for press freedom. Greece ranks 86th. Both are EU member states. The 33-point gap between them reflects a split inside the EU that

Key Takeaways Healthy Life Years and Life Expectancy Across EU Countries Country Healthy Life Years at Birth Life Expectancy at Birth Malta 70.2 (p) 82.4 Italy 67.4 82.8 Greece 67.0

Key Takeaways Employed Persons Usually Working From Home Across EU Countries Country Employed persons usually working from home 2006 (%) 2025 (%) Change (pp) Finland 9.3 20.9 +11.6 Ireland 7.1

Key Takeaways EU Countries Ranked by PISA Reading, Mathematics, and Science Scores Country PISA Scores Mathematics Reading Science Estonia 509.9 511.0 525.8 Netherlands 492.7 459.2 488.3 Ireland 491.6 516.0 503.8
Key Takeaways Extra-EU Exports by EU Member State Country Extra-EU Exports (In billion euros, % of total EU exports) 2014 2025 Germany 555.6 (30.9%) 689.2 (26.1%) Italy 201.0 (11.2%) 313.0

Key Takeaways EU Countries by Household Out-of-Pocket Health Costs Country Household out-of-pocket payment for healthcare costs PPS per person Share of total health expenditure Bulgaria 736 35.5% Latvia 691

Key Takeaways At-Risk-of-Poverty Rate by EU Country Country At-Risk-of-Poverty Rate 2010 (%) 2025 (%) Change in pp Estonia 15.8 19.5 +3.7 Netherlands 10.3 13.4 +3.1 France 13.3 16.3 +3.0 Lithuania

Key Takeaways Highest-Paid EU Athletes on the Forbes Global List Global Rank Name Sport Country Total Earnings 1 Cristiano Ronaldo Soccer Portugal $300M 7 Jon Rahm Golf Spain $107M 8
You are currently viewing a placeholder content from Vimeo. To access the actual content, click the button below. Please note that doing so will share data with third-party providers.
More InformationYou are currently viewing a placeholder content from YouTube. To access the actual content, click the button below. Please note that doing so will share data with third-party providers.
More InformationYou need to load content from reCAPTCHA to submit the form. Please note that doing so will share data with third-party providers.
More InformationYou are currently viewing a placeholder content from Google Maps. To access the actual content, click the button below. Please note that doing so will share data with third-party providers.
More InformationYou are currently viewing a placeholder content from Google Maps. To access the actual content, click the button below. Please note that doing so will share data with third-party providers.
More InformationYou are currently viewing a placeholder content from Mapbox. To access the actual content, click the button below. Please note that doing so will share data with third-party providers.
More InformationYou are currently viewing a placeholder content from OpenStreetMap. To access the actual content, click the button below. Please note that doing so will share data with third-party providers.
More Information