Key Takeaways
- Employment of 20 to 64-year-olds in the EU grew by 9.2% between 2009 and 2024. There was an addition of 16.5 million persons.
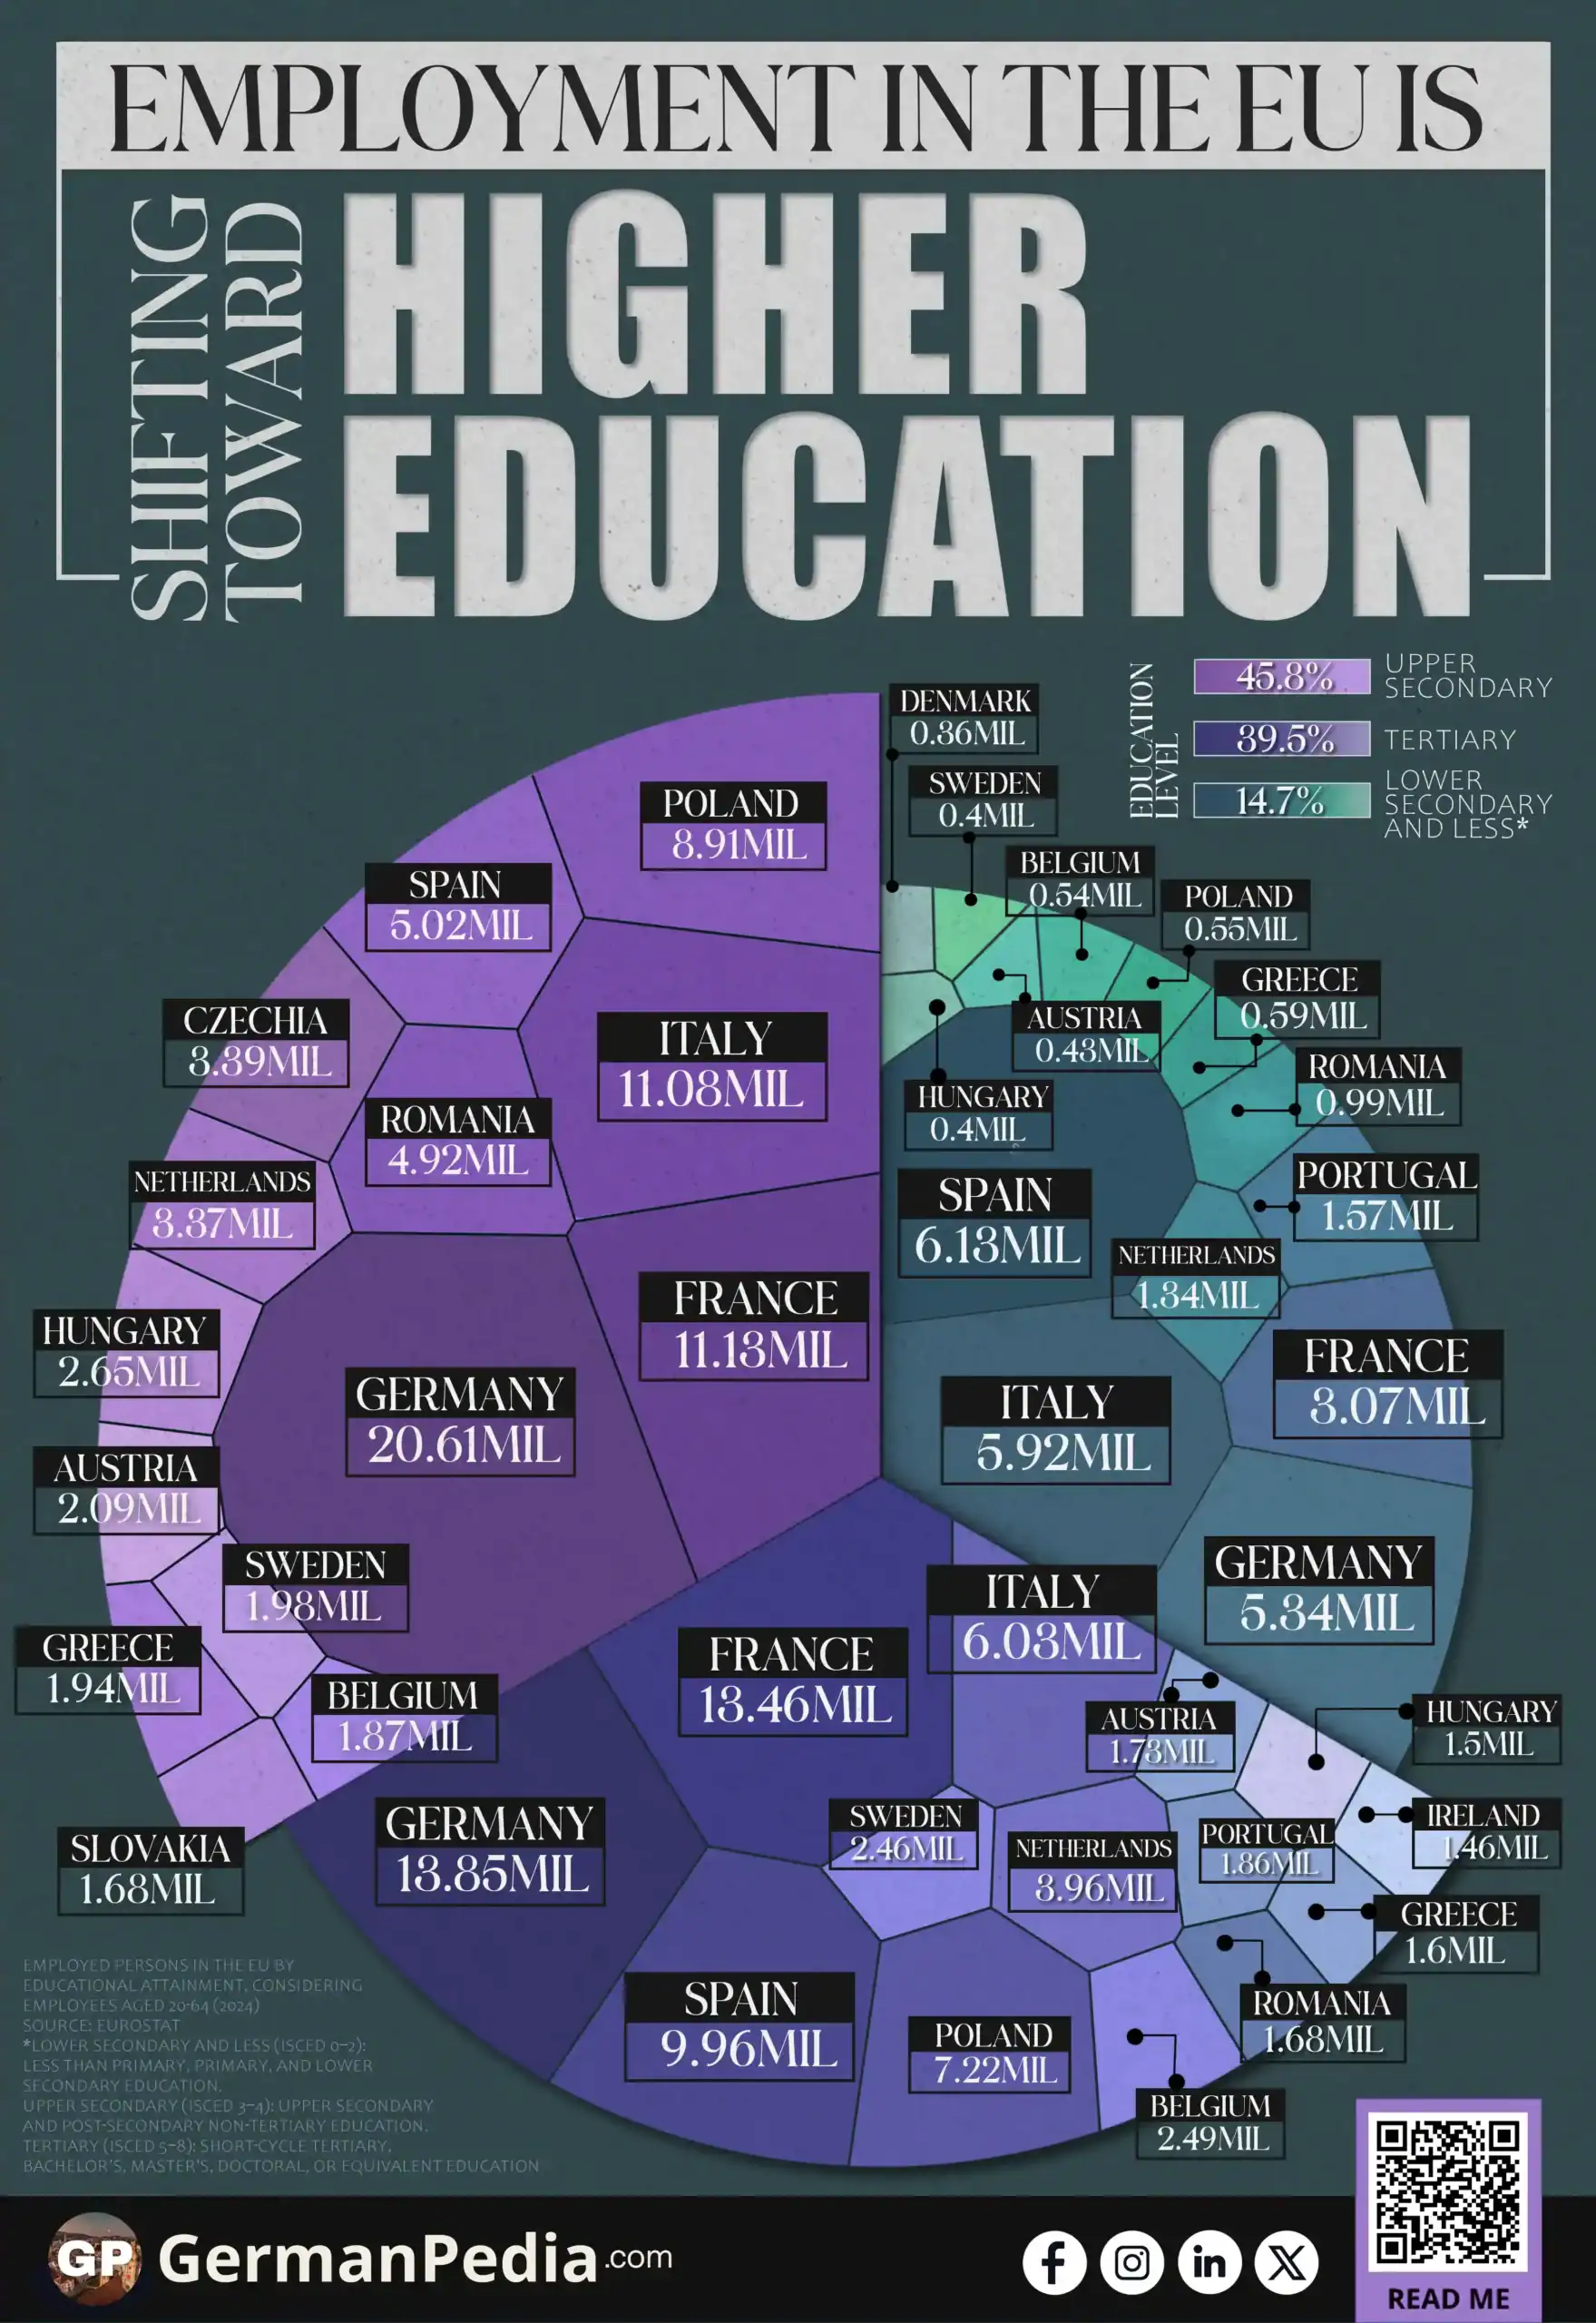
- Employment among adults with low education fell by 26.8%. Their share dropped from 22.0% to 14.7%.
- Employed persons who finished upper secondary education remained the largest qualification group. They account for more than 40% of total employment in 2009 and 2024.
- Employment among tertiary-educated adults rose by over 50%. Their share increased from 28.1% to 39.5%. Demographic replacement, rising educational attainment, and growth in service sectors contributed to this structural shift.
Use this Visualization: You may use this image for free with proper attribution to GermanPedia (i.e., by linking back to GermanPedia).
Need help communicating complex ideas visually? We help you turn data into your most persuasive story. Contact us to learn more.
EU Employment by Educational Attainment
| Education Level* | Employed persons (In millions) | |
|---|---|---|
| 2009 | 2024 | |
| Lower secondary and less | 39.63 (22.0%) | 28.99 (14.7%) |
| Upper secondary | 89.88 (49.9%) | 90.14 (45.8%) |
| Tertiary | 50.69 (28.1%) | 77.58 (39.5%) |
| Total | 180.20 | 196.71 |
Source: Eurostat
*Lower secondary and less (ISCED 0–2): Less than primary, primary, and lower secondary education.
Upper secondary (ISCED 3–4): Upper secondary and post-secondary non-tertiary education.
Tertiary (ISCED 5–8): Short-cycle tertiary, bachelor’s, master’s, doctoral, or equivalent education.

Between 2009 and 2024, the structure of employment in the European Union shifted in a clear direction. Employees from lower levels of education became less common, while those who finished tertiary education increased strongly.
Overall employment increased by 9.2%. That is about 16.5 million people. However, the more important change was its composition. The EU workforce started gravitating more towards employees with higher education.
We break down these numbers in the tables below.
EU Employment with Low Educational Attainment
| Country | Employed persons (In millions) | % Change | |
|---|---|---|---|
| 2009 | 2024 | ||
| EU Total | 39.63* | 28.99 | −26.8% |
| Spain | 7.49 | 6.13** | −18.2% |
| Italy | 8.14 | 5.92 | −27.3% |
| Germany | 4.76 | 5.34 | +12.1% |
| France | 5.89 | 3.07** | −47.8% |
| Portugal | — | 1.57 | — |
| Netherlands | 1.88 | 1.34 | −28.7% |
| Romania | 1.17 | 0.99 | −15.3% |
| Greece | 1.60 | 0.59 | −63.3% |
| Poland | 0.97 | 0.55 | −43.7% |
| Belgium | 0.80 | 0.54 | −32.9% |
| Austria | 0.49 | 0.43 | −12.2% |
| Sweden | 0.60 | 0.40 | −33.1% |
| Hungary | 0.44 | 0.40 | −7.6% |
| Denmark | 0.53 | 0.36 | −31.6% |
| Bulgaria | 0.43 | 0.23*** | −47.1% |
| Czechia | 0.25 | 0.22 | −12.6% |
| Finland | 0.35 | 0.18 | −47.9% |
| Ireland | — | 0.17 | — |
| Croatia | 0.26 | 0.08 | −68.6% |
| Malta | 0.08 | 0.08 | −6.2% |
| Slovakia | 0.07 | 0.07 | 0.0% |
| Slovenia | 0.11 | 0.07 | −30.2% |
| Latvia | 0.08 | 0.06 | −22.7% |
| Estonia | 0.06 | 0.06 | −3.2% |
| Cyprus | 0.08 | 0.06 | −32.5% |
| Lithuania | 0.07 | 0.05 | −18.5% |
| Luxembourg | 0.04 | 0.04 | +5.1% |
Source: Eurostat
*EU-27 aggregate reported by Eurostat. It is not equal to the sum of the displayed country values due to unreported data
**definition differs slightly from the standard EU method
***break in time series
In 2009, 39.6 million employed adults in the EU had lower secondary education at most. By 2024, that number had fallen to about 29.0 million. It showed a decline of 26.8%.
Most Member States recorded reductions. In Greece and Croatia, the number of low-educated employed persons even fell by more than 60%.
The shift does not mean people without formal qualifications no longer work. Instead, it shows that employment growth has not taken place in this group. Over time, the EU labour market appears less reliant on workers with only basic schooling.
EU Employment with Upper Secondary Educational Attainment
| Country | Employed persons (In millions) | % Change | |
|---|---|---|---|
| 2009 | 2024 | ||
| European Union (EU-27) | 89.88* | 90.14 | +0.3% |
| Germany | 20.43 | 20.61 | +0.9% |
| France | 11.49 | 11.13 | −3.1% |
| Italy | 10.14 | 11.08 | +9.3% |
| Poland | 9.95 | 8.91** | −10.4% |
| Spain | 4.49 | 5.02** | +11.7% |
| Romania | 4.84 | 4.92 | +1.6% |
| Czechia | 3.76 | 3.39 | −9.9% |
| Netherlands | 3.52 | 3.37 | −4.4% |
| Hungary | 2.48 | 2.65 | +6.9% |
| Austria | 2.46 | 2.09 | −14.8% |
| Sweden | 2.09 | 1.98 | −5.3% |
| Greece | 1.69 | 1.94 | +14.8% |
| Belgium | 1.69 | 1.87 | +11.0% |
| Slovakia | 1.87 | 1.68 | −10.0% |
| Portugal | — | 1.61 | — |
| Bulgaria | 1.85 | 1.53*** | −17.6% |
| Denmark | 1.11 | 1.15 | +3.2% |
| Finland | 1.09 | 1.15 | +6.1% |
| Croatia | 1.08 | 0.99 | −8.0% |
| Ireland | — | 0.85 | — |
| Lithuania | 0.75 | 0.62 | −17.5% |
| Slovenia | 0.56 | 0.53 | −5.4% |
| Latvia | 0.54 | 0.41 | −24.6% |
| Estonia | 0.28 | 0.31 | +8.1% |
| Cyprus | 0.15 | 0.16 | +11.6% |
| Malta | 0.04 | 0.11 | +173.2% |
| Luxembourg | 0.09 | 0.09 | −2.3% |
Source: Eurostat
*EU-27 aggregate reported by Eurostat. It is not equal to the sum of the displayed country values due to unreported data
**definition differs slightly from the standard EU method
***break in time series
Employed persons with upper secondary education remain the largest qualification group in the workforce. However, the numbers barely changed at the EU level. There were 89.9 million employed persons with upper secondary education at most in 2009, compared with 90.1 million in 2024. That is an increase of just 0.3%.
The main structural shift is happening above and below this group.
EU Employment with Tertiary Educational Attainment
| Country | Employed persons (In millions) | % Change | |
|---|---|---|---|
| 2009 | 2024 | ||
| European Union (EU-27) | 50.69* | 77.58 | +53.1% |
| Germany | 10.69 | 13.85 | +29.5% |
| France | 8.47 | 13.46 | +58.9% |
| Spain | 6.77 | 9.96** | +47.1% |
| Poland | 4.01 | 7.22** | +79.9% |
| Italy | 3.77 | 6.03 | +60.0% |
| Netherlands | 2.40 | 3.96 | +65.0% |
| Belgium | 1.81 | 2.49 | +37.8% |
| Sweden | 1.47 | 2.46 | +67.3% |
| Romania | 1.36 | 1.81 | +33.4% |
| Austria | 0.76 | 1.73 | +126.7% |
| Portugal | — | 1.68 | — |
| Greece | 1.21 | 1.60 | +33.0% |
| Hungary | 0.94 | 1.50 | +59.7% |
| Ireland | — | 1.46 | — |
| Czechia | 0.82 | 1.38 | +68.7% |
| Denmark | 0.81 | 1.24 | +53.3% |
| Finland | 0.88 | 1.08 | +22.9% |
| Bulgaria | 0.86 | 1.06*** | +23.6% |
| Slovakia | 0.45 | 0.80 | +76.8% |
| Lithuania | 0.47 | 0.71 | +50.1% |
| Croatia | 0.34 | 0.56 | +64.3% |
| Slovenia | 0.25 | 0.37 | +43.7% |
| Latvia | 0.25 | 0.35 | +40.2% |
| Estonia | 0.23 | 0.28 | +23.1% |
| Cyprus | 0.14 | 0.25 | +77.7% |
| Luxembourg | 0.08 | 0.19 | +129.6% |
| Malta | 0.03 | 0.12 | +293.3% |
Source: Eurostat
*EU-27 aggregate reported by Eurostat. It is not equal to the sum of the displayed country values due to unreported data
**definition differs slightly from the standard EU method
***break in time series
The most visible change occurred at the top end of the qualification scale.
Employment among tertiary-educated adults rose from 50.7 million in 2009 to 77.6 million in 2024. That is an increase of almost 27 million people, or more than 50%.
This pattern appears across both large and smaller Member States. The EU labour market is not simply creating more jobs. It is increasingly employing people with higher formal qualifications.
Why Has Employment Shifted Upward?
Three longer-term forces help explain the change.
First, demographic replacement matters. Older cohorts in the workforce generally had lower formal educational attainment than younger ones. As many of these workers retire, they are replaced by younger cohorts who are more likely to hold upper secondary or tertiary qualifications. This alone shifts the educational profile of employment upward.
Second, educational attainment has increased across the EU. The share of young adults completing tertiary education has risen steadily over the past decade. As more graduates enter the labour market, the number of tertiary-educated workers in employment grows.
Third, labour demand has also evolved. Employment growth has been concentrated in service sectors, including healthcare, education, and other knowledge-intensive activities. In contrast, routine factory jobs have grown more slowly in many countries. This does not mean that medium-skilled jobs have not disappeared. Instead, it shows that higher-qualified roles now account for a larger share of employment.
Germany’s Fastest-Growing Jobs by LinkedIn ->
These factors reinforce one another. More people complete higher levels of education, and these qualifications are increasingly valued in growing service sectors. Across the EU, employment rates rise with educational attainment. In Germany, for example, adults with tertiary education are significantly more likely to be employed than those with only lower secondary schooling.
Taken together, the EU labour market is expanding upward. Its growth is concentrated among higher-qualified workers.
More topics
- Germany’s Median Wage by Federal State
- Employment by Federal State in Germany
- Germany’s Average Working Age Is Getting Older
- Germany’s Gender Employment Gap Narrowed Over Six Decades
- Germany’s Gender Pay Gap in Full-Time Work Falls to 9%
- Women Are Increasing in Managerial Roles Across the EU
- Women Hold Less Than One Third of Managerial Roles in Germany
- Top 10 Largest Employers in Germany
- Germans Earn More Than Foreign Workers Across Germany
- Top German Companies by Revenue
- Top Companies in Germany by LinkedIn (2021-2025)
- Unemployment Across Germany: A Federal State Breakdown
- Germany’s Fastest-Growing Jobs by LinkedIn
- Employment Legal Insurance in Germany
- Highest Paying Jobs in Germany
References
- https://ec.europa.eu/eurostat/databrowser/view/lfsi_educ_a__custom_20343923/default/table
- https://ec.europa.eu/eurostat/statistics-explained/index.php?title=Educational_attainment_statistics
- https://ec.europa.eu/eurostat/statistics-explained/index.php?title=Employment_-_annual_statistics
- https://www.oecd.org/en/publications/2025/09/education-at-a-glance-2025-country-notes_9749f4ff/germany_52735cfb.html
- https://www.bpb.de/kurz-knapp/zahlen-und-fakten/soziale-situation-in-deutschland/61691/erwerbstaetigenquoten-nach-bildung-und-staatsangehoerigkeit/
- https://ec.europa.eu/eurostat/databrowser/view/lfsa_egan22d__custom_20350490/default/table