Key Takeaways
- The EU’s senior share rose from 15.8% to 22.0% of the total population between 2001 and 2025. Its 65-plus population grew 45.8% over that period.
- Italy (24.7%), Portugal (24.3%), and Bulgaria (24.0%) hold the highest senior shares in the EU. Luxembourg (15.2%), Ireland (15.7%), and Cyprus (18.3%) hold the lowest.
- Poland recorded the steepest rise of any EU country. It climbed by 8.7 percentage points between 2001 and 2025.
- Countries with the highest shares of foreign-born residents (e.g., Luxembourg) tend to keep lower senior shares.
- Rising life expectancy and persistently low birth rates are pulling the EU’s population older from both ends. This pattern will continue through the rest of the century.
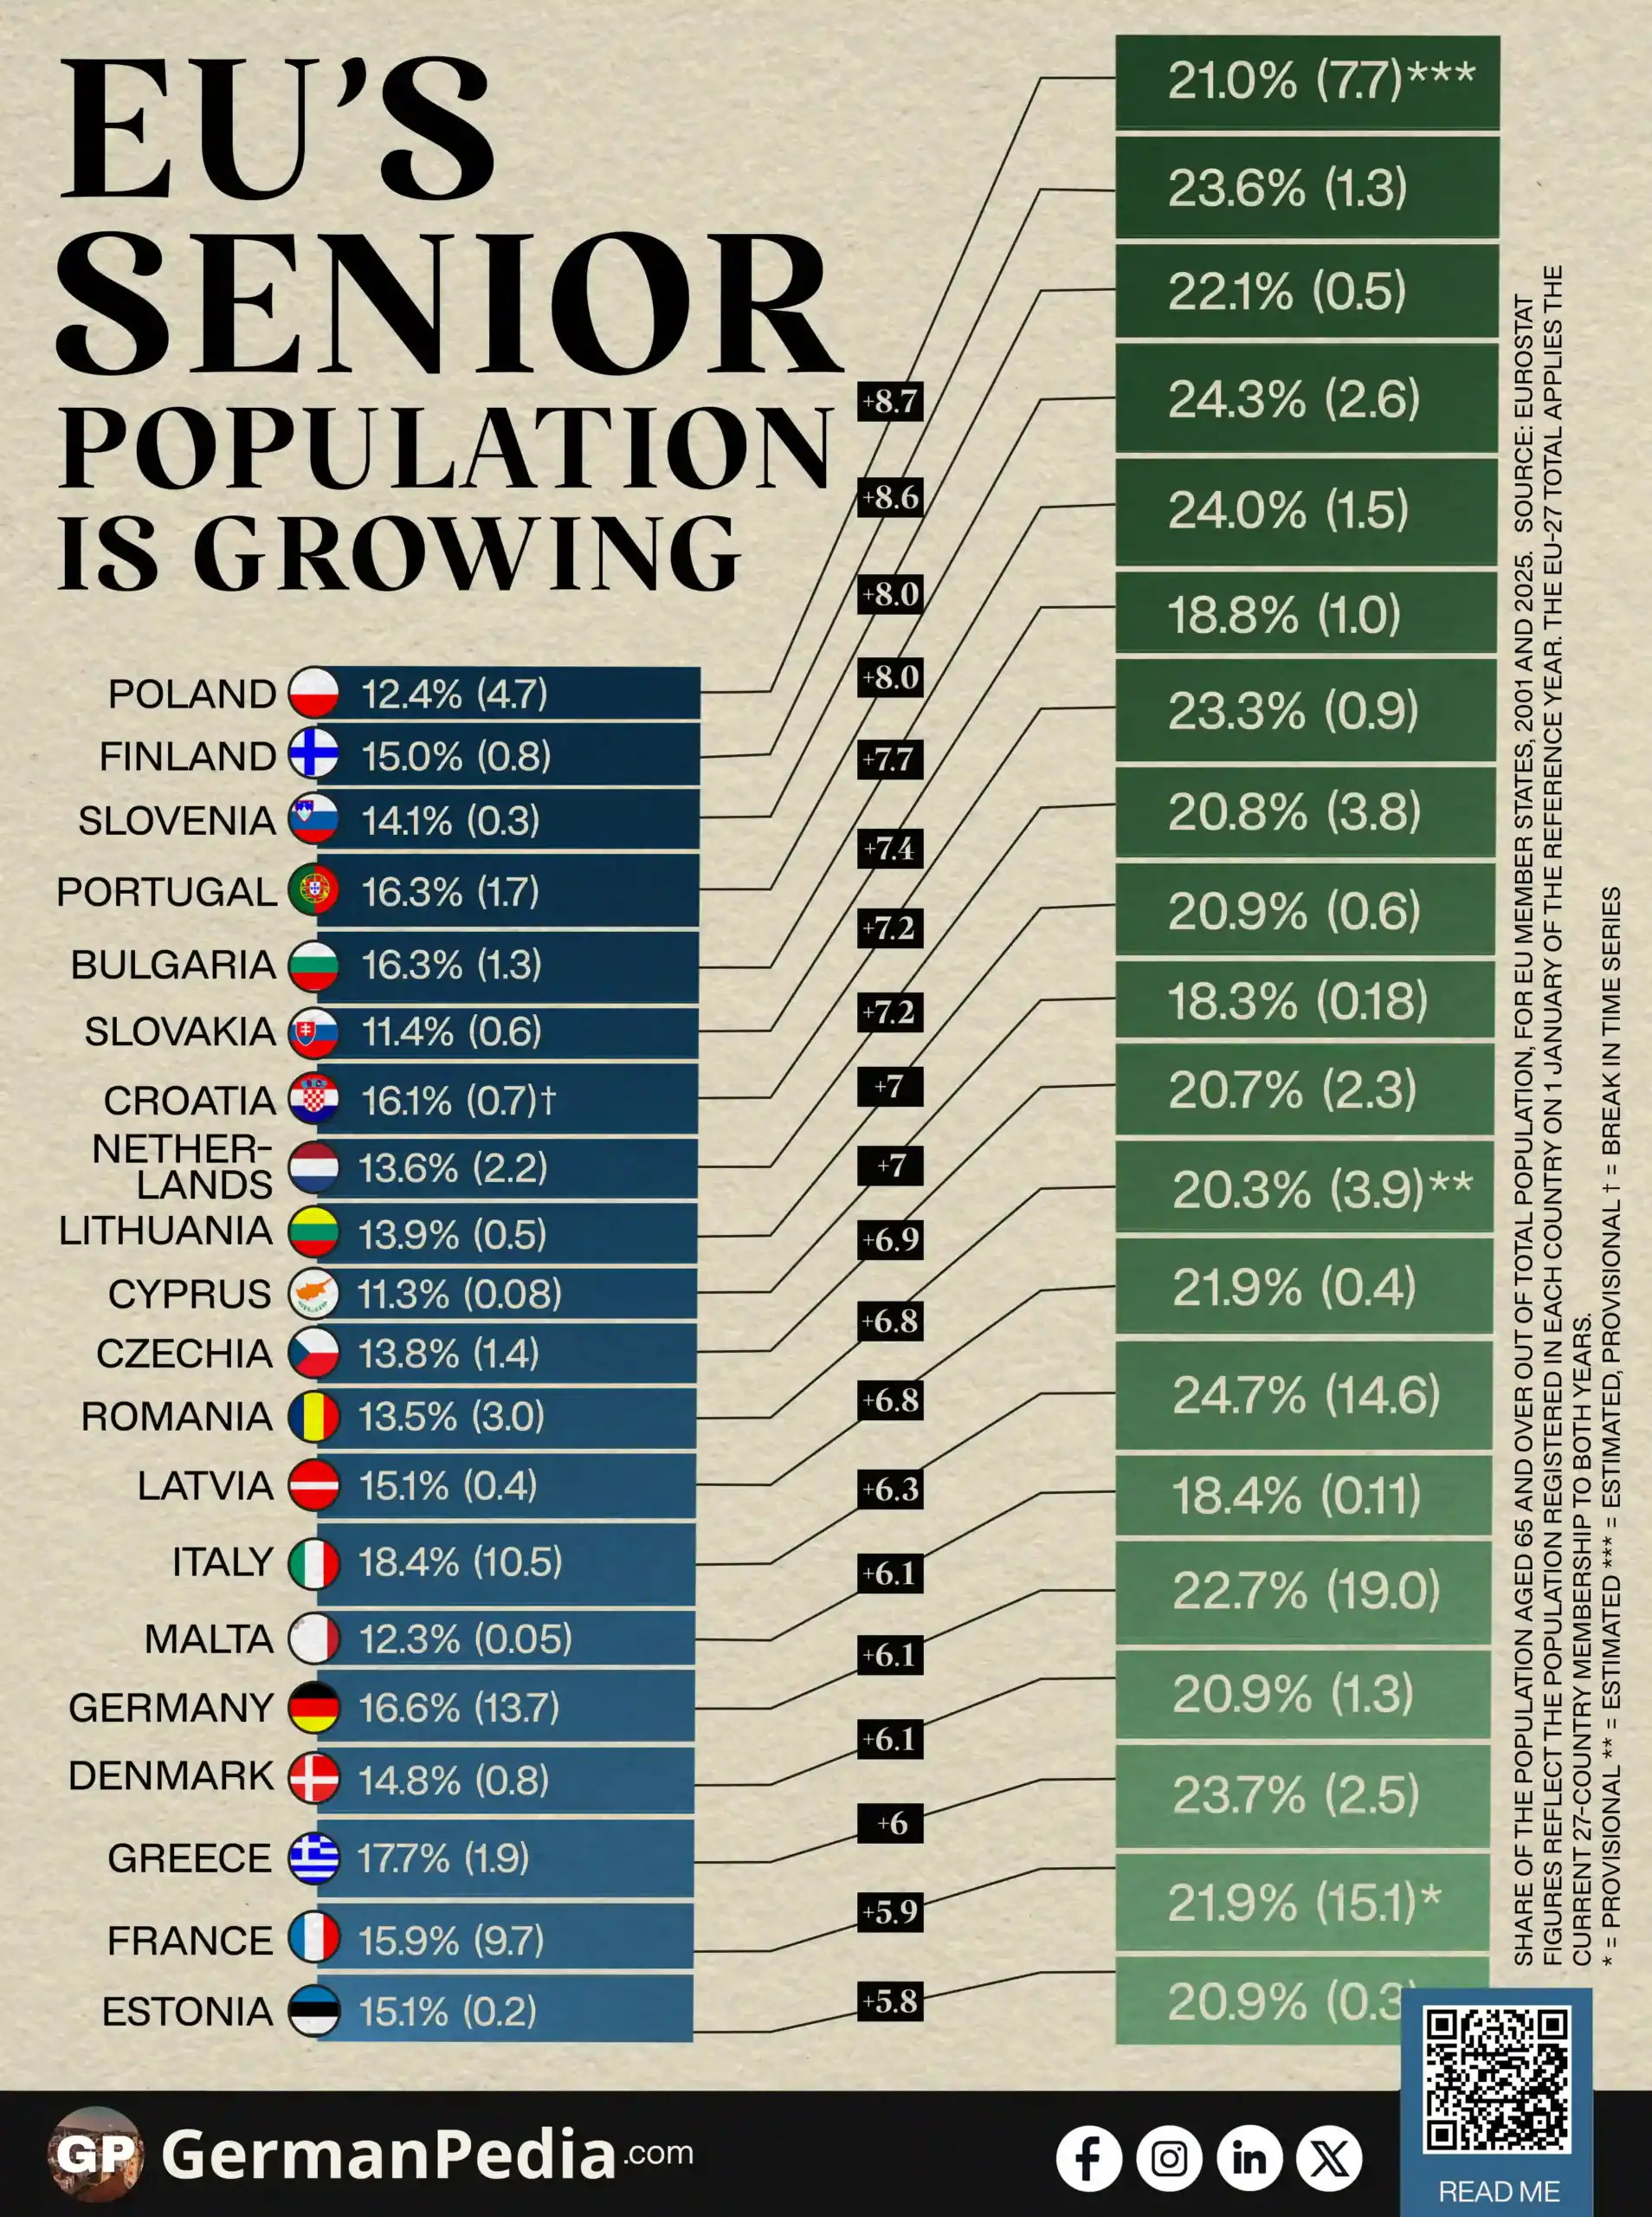
Use this Visualization: You may use this image for free with proper attribution to GermanPedia (i.e., by linking back to GermanPedia).
Need help communicating complex ideas visually? We help you turn data into your most persuasive story. Contact us to learn more.
Rising Share of Senior Population Across EU Countries
| Country | Population aged 65+ (% of total population, in mil.) | ||
|---|---|---|---|
| 2001 | 2025 | Change (pp) | |
| European Union | 15.8% (67.9)† | 22.0% (99.0)*** | +6.1 |
| Italy | 18.4% (10.5) | 24.7% (14.6) | +6.3 |
| Portugal | 16.3% (1.7) | 24.3% (2.6) | +8.0 |
| Bulgaria | 16.3% (1.3) | 24.0% (1.5) | +7.7 |
| Greece | 17.7% (1.9) | 23.7% (2.5) | +6.0 |
| Finland | 15.0% (0.8) | 23.6% (1.3) | +8.6 |
| Croatia | 16.1% (0.7)† | 23.3% (0.9) | +7.2 |
| Germany | 16.6% (13.7) | 22.7% (19.0) | +6.1 |
| Slovenia | 14.1% (0.3) | 22.1% (0.5) | +8.0 |
| Latvia | 15.1% (0.4) | 21.9% (0.4) | +6.8 |
| France | 15.9% (9.7) | 21.9% (15.1)* | +5.9 |
| Poland | 12.4% (4.7) | 21.0% (7.7)*** | +8.7 |
| Estonia | 15.1% (0.2) | 20.9% (0.3) | +5.8 |
| Lithuania | 13.9% (0.5) | 20.9% (0.6) | +7.0 |
| Hungary | 15.1% (1.5) | 20.9% (2.0) | +5.7 |
| Denmark | 14.8% (0.8) | 20.9% (1.3) | +6.1 |
| Sweden | 17.2% (1.5) | 20.8% (2.2) | +3.6 |
| Netherlands | 13.6% (2.2) | 20.8% (3.8) | +7.2 |
| Spain | 16.8% (6.8) | 20.7% (10.2) | +3.9 |
| Czechia | 13.8% (1.4) | 20.7% (2.3) | +6.9 |
| Romania | 13.5% (3.0) | 20.3% (3.9)** | +6.8 |
| Belgium | 16.9% (1.7) | 20.2% (2.4) | +3.4 |
| Austria | 15.4% (1.2) | 20.2% (1.9) | +4.8 |
| Slovakia | 11.4% (0.6) | 18.8% (1.0) | +7.4 |
| Malta | 12.3% (0.05) | 18.4% (0.11) | +6.1 |
| Cyprus | 11.3% (0.08) | 18.3% (0.18) | +7.0 |
| Ireland | 11.2% (0.4) | 15.7% (0.9) | +4.5 |
| Luxembourg | 13.9% (0.06) | 15.2% (0.10) | +1.4 |
Source: Eurostat
Figures reflect the population registered in each country on 1 January of the reference year. The EU-27 total applies the current 27-country membership to both years.
* = provisional ** = estimated *** = estimated, provisional † = break in time series

==
Rising Life Expectancy and Falling Birth Rates Are Aging the EU From Both Ends
People aged 65 and over made up 22.0% of the EU’s population on 1 January 2025. That means more than one in five people living in the European Union are 65 or older today.
Between 2001 and 2025, the EU’s total population grew just 5.0% from 429.2 to 450.6 million. Its 65-plus population grew 45.8%, increasing from 67.9 to 99.0 million. That is more than 9 times as fast.
Two separate forces drive that share upward.
- Rising life expectancy is pushing more people into the 65-plus group each year.
- Persistently low birth rates mean fewer children are entering the population at the bottom.
Italy, Portugal, and Bulgaria Have the EU’s Highest Senior Shares
Three countries lead the EU in senior population share:
- Italy: 24.7%
- Portugal: 24.3%
- Bulgaria: 24.0%
Greece (23.7%) and Finland (23.6%) follow closely behind.
The three countries recorded more deaths than births in 2025. Immigration offset that gap enough to keep Portugal’s population growing. It was not enough in Italy and Bulgaria, where total population fell.
Three countries hold the EU’s lowest senior shares:
- Luxembourg: 15.2%
- Ireland: 15.7%
- Cyprus: 18.3%
All three also rank among the countries with the highest shares of foreign-born residents. Luxembourg’s foreign-born share is 51.5%. That is the highest in the EU.
Foreign-Born Population in the EU Is Rising ->
Immigrants arrive in the EU at a median age of 30.2. The EU’s overall population has a median age of 44.9. Median age marks the midpoint, where half the population is younger, and half is older. Because immigrants arrive younger than the people already living in a country, immigration pulls a country’s average age down over time.
Ireland’s total population grew 42% between 2001 and 2025. It is one of the fastest rates in the EU. Its senior population nearly doubled over the same period. That rapid overall growth kept Ireland’s senior share increase to just 4.5 percentage points. That is the second-smallest increase in the EU.
Poland’s Senior Share Is Climbing Fastest in the EU
Poland recorded the steepest rise of any EU country. It climbed by 8.7 percentage points between 2001 and 2025. The share rose from 12.4% to 21.0%. That is the largest increase recorded by any EU country over that period.
Poland’s total population fell from 38.3 million to 36.5 million between 2001 and 2025. Poland’s total fertility rate also stood below 1.30 births per woman in 2024. Eurostat classifies that level as “lowest-low fertility.” Fewer young people enter the population while the total it is divided by keeps shrinking.
All of the EU member states recorded a rise in their senior share between 2001 and 2025. Two forces set the pace locally: a country’s birth rate and its ability to attract immigrants. Low birth rates paired with little immigration age a country quickly. Immigration slows that aging.
More topics
- Foreign-Born Population in the EU Is Rising
- German Population Growth Between 1997 and 2025
- Which EU Country Has the Most Healthy Life Years?
- Which EU Country Recycles the Most?
- Top 10 Leading Causes of Death in the EU
- GDP per Capita vs Actual Consumption per Capita in the EU
- Which Country Owns Almost a Quarter of the EU’s Wealth?
- Most Popular Degree Programs in Germany
- Which are the toughest prisons in the EU?
- Germany’s Healthcare Expenditure Vs. Aging Population
- Which EU Countries Had the Highest Inflation Rates?
- EU Fertility Rate by Country
- Average Working Hours in EU Countries
- The Best EU Countries to Retire In
- Which EU Country Uses the Most Electricity?
References
- https://ec.europa.eu/eurostat/databrowser/view/demo_pjanbroad/default/table?lang=en
- https://ec.europa.eu/eurostat/statistics-explained/index.php?title=Population_structure_and_ageing
- https://ec.europa.eu/eurostat/statistics-explained/index.php?title=Migration_to_and_from_the_EU
- https://ec.europa.eu/eurostat/statistics-explained/index.php?title=EU_population_diversity_by_citizenship_and_country_of_birth
- https://ec.europa.eu/eurostat/statistics-explained/index.php?title=Fertility_statistics