Key Takeaways
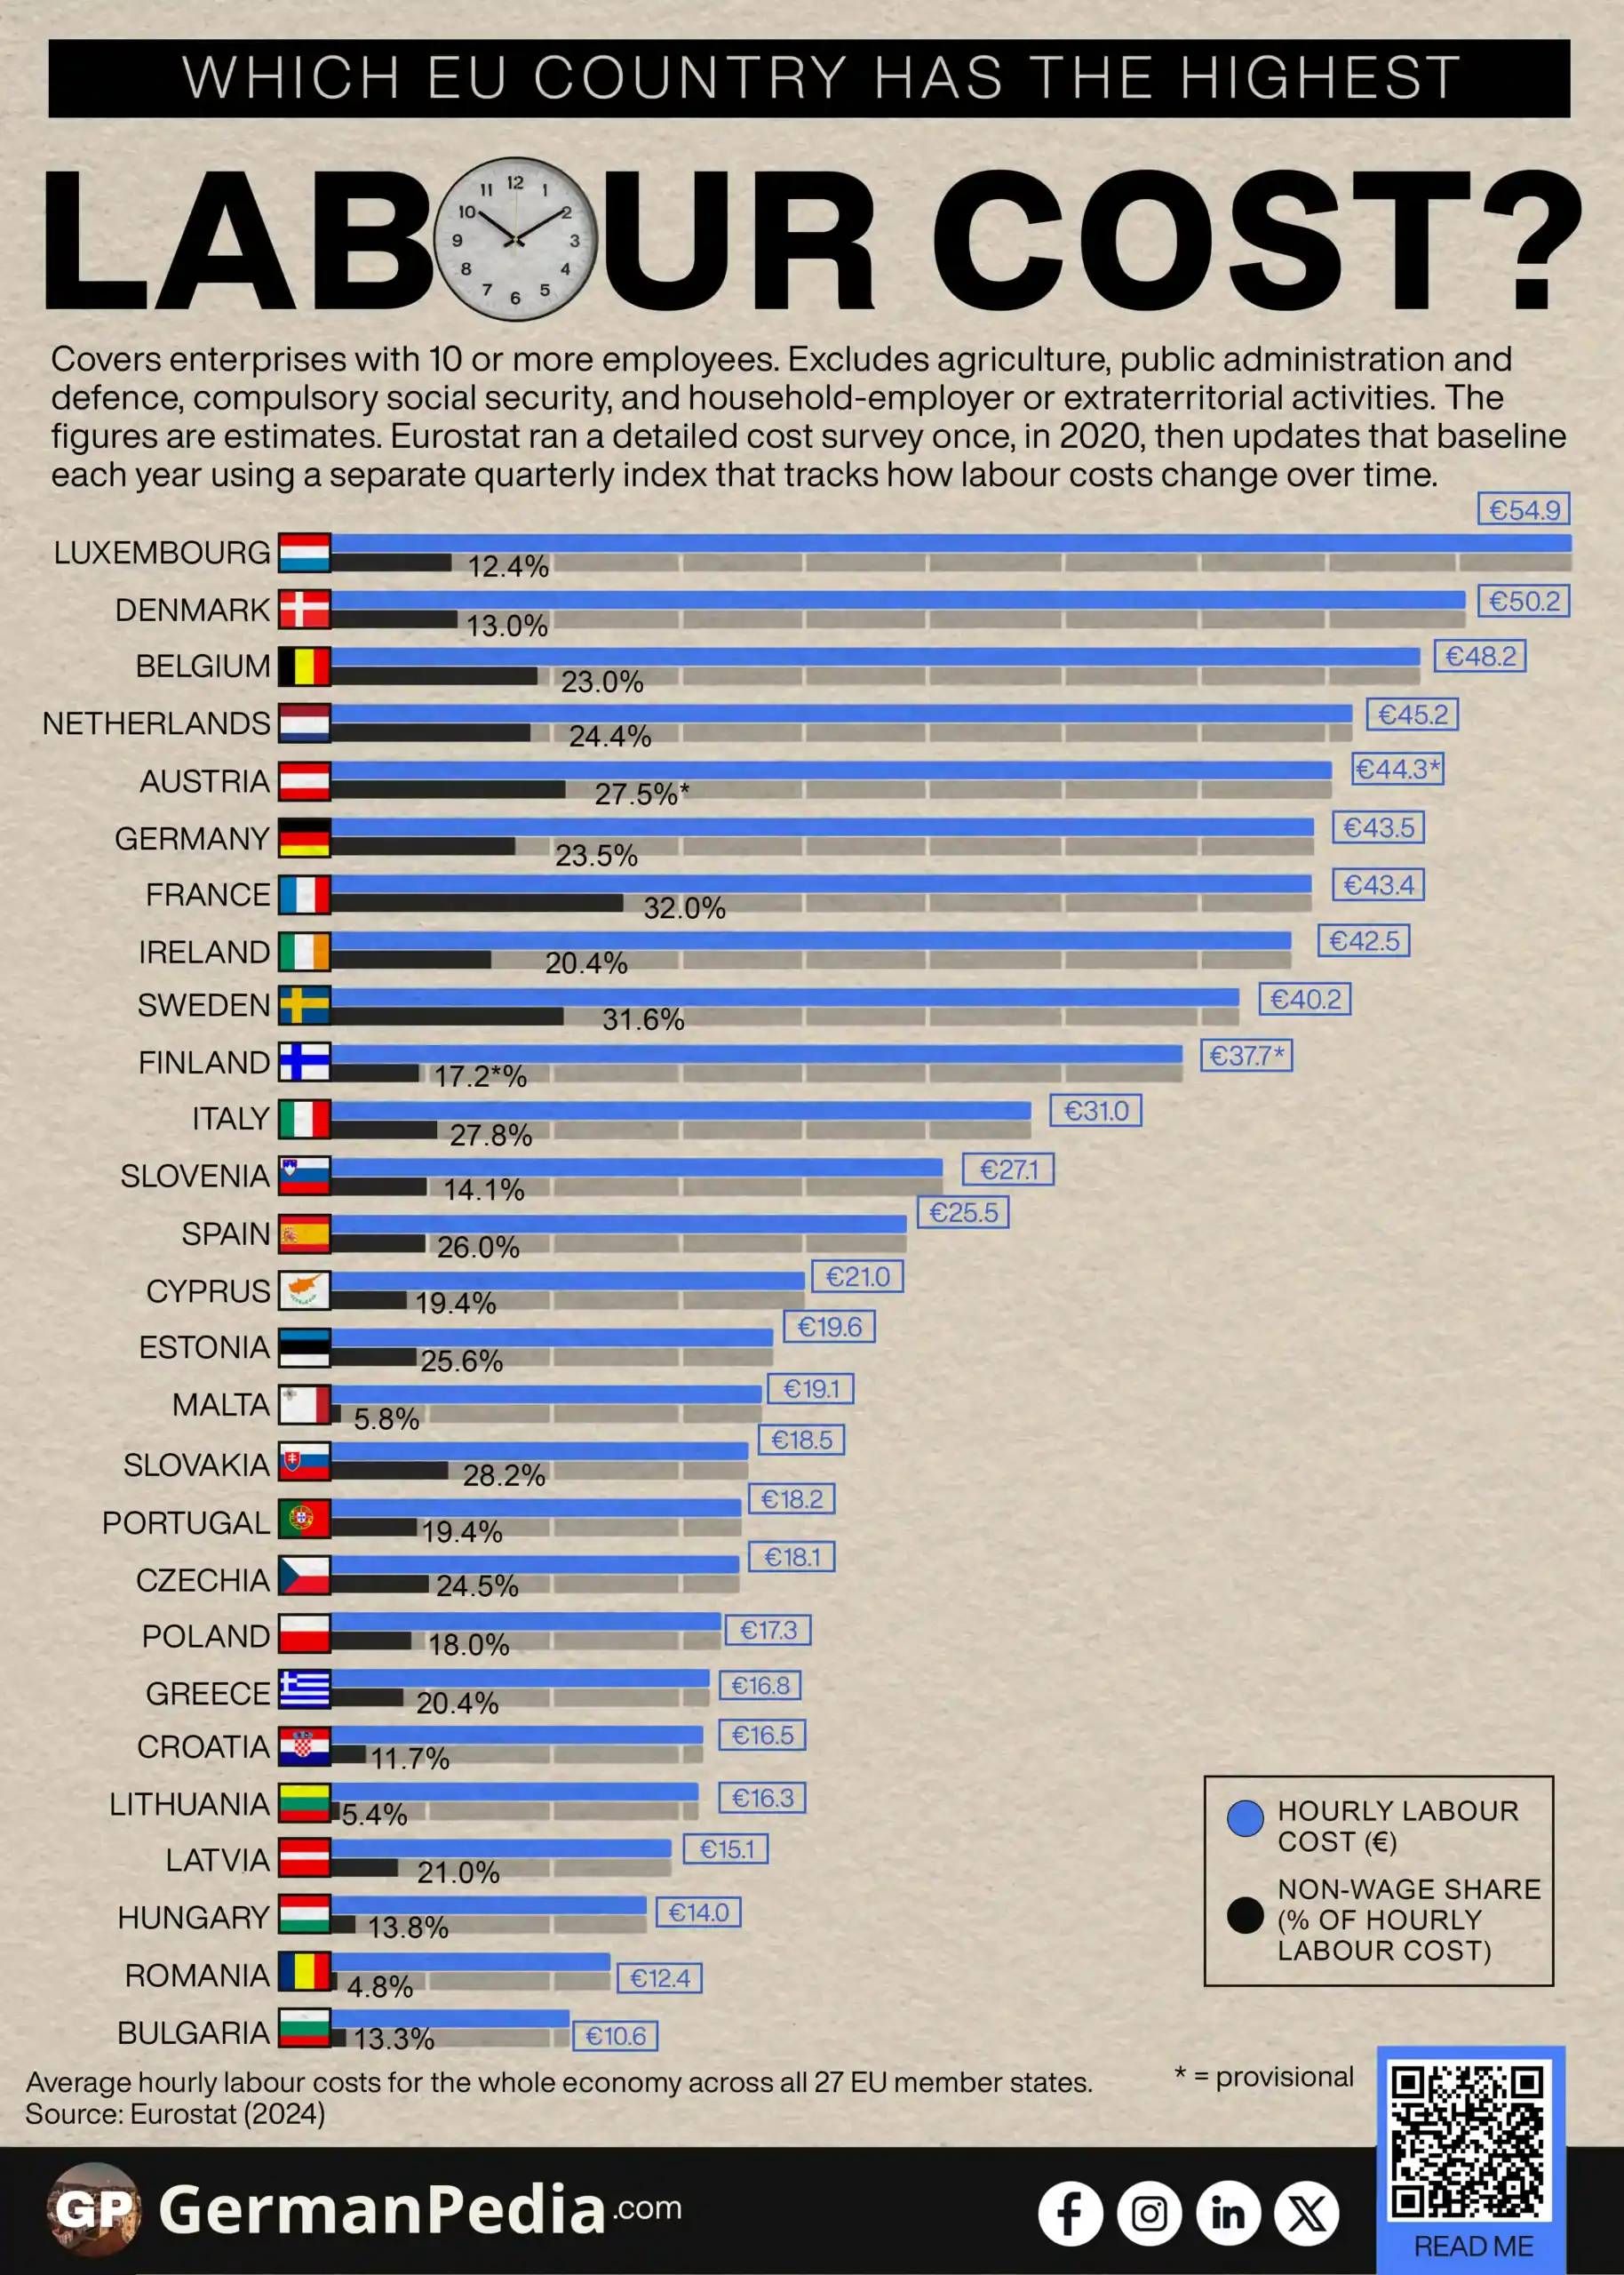
- Luxembourg’s hourly labour cost of €54.9 is the highest in the EU. Bulgaria’s €10.6 is the lowest in the EU. The gap between them is more than five times.
- Only 10 of the EU’s 27 member states pay above the EU average of €33.5 per hour.
- Luxembourg’s high labour cost comes almost entirely from wages. Its non-wage share is just 12.4%. That is well below the EU average of 24.7%.
- Germany (€43.5) and France (€43.4) pay nearly identical total labour costs. France routes 32% of that into non-wage costs such as social contributions. Germany routes 23.5% into the same category.
- Labour costs across the EU rise and fall mainly with how wealthy the underlying economy is, not with how a country splits pay between wages and benefits.
Use this Visualization: You may use this image for free with proper attribution to GermanPedia (i.e., by linking back to GermanPedia).
Need help communicating complex ideas visually? We help you turn data into your most persuasive story. Contact us to learn more.
Hourly Labour Costs Across EU Countries
| EU Country | Hourly Labour Cost (€) | Non-Wage Share (% of hourly labour cost) How much goes to social contributions, etc.? |
|---|---|---|
| Luxembourg | 54.9 | 12.4 |
| Denmark | 50.2 | 13.0 |
| Belgium | 48.2 | 23.0 |
| Netherlands | 45.2 | 24.4 |
| Austria | 44.3* | 27.5* |
| Germany | 43.5 | 23.5 |
| France | 43.4 | 32.0 |
| Ireland | 42.5 | 20.4 |
| Sweden | 40.2 | 31.6 |
| Finland | 37.7* | 17.2* |
| Italy | 31.0 | 27.8 |
| Slovenia | 27.1 | 14.1 |
| Spain | 25.5 | 26.0 |
| Cyprus | 21.0 | 19.4 |
| Estonia | 19.6 | 25.6 |
| Malta | 19.1 | 5.8 |
| Slovakia | 18.5 | 28.2 |
| Portugal | 18.2 | 19.4 |
| Czechia | 18.1 | 24.5 |
| Poland | 17.3 | 18.0 |
| Greece | 16.8 | 20.4 |
| Croatia | 16.5 | 11.7 |
| Lithuania | 16.3 | 5.4 |
| Latvia | 15.1 | 21.0 |
| Hungary | 14.0 | 13.8 |
| Romania | 12.4 | 4.8 |
| Bulgaria | 10.6 | 13.3 |
Source: Eurostat (2024)
Covers enterprises with 10 or more employees. Excludes agriculture, public administration and defence, compulsory social security, and household-employer or extraterritorial activities. The figures are estimates. Eurostat ran a detailed cost survey once, in 2020, then updates that baseline each year using a separate quarterly index that tracks how labour costs change over time.
* = provisional

An hour of work costs €54.9 in Luxembourg. The same hour costs €10.6 in Bulgaria. Both figures sit inside the same 27-country market, in the same year.
The table shows two figures for each country. Hourly labour cost is the total an employer pays for one hour of work, wages and everything else combined. Non-wage share is the percentage of that total spent on costs other than pay, mainly employer social contributions, rather than the worker’s paycheck.
The EU-wide average is €33.5 per hour. Only 10 of the 27 member states pay above it.
Luxembourg and Bulgaria’s Labour Costs Track How Wealthy Each Economy Is
An hour of work costs €54.9 in Luxembourg. The same hour costs €10.6 in Bulgaria.
Luxembourg’s high labour cost comes down to one thing. It is one of the richest countries in the EU. Luxembourg’s GDP per capita is more than double the EU average. It sits at 239% of the EU average in 2025. Luxembourg’s wages track that wealth closely.
GDP per Capita in EU Countries ->
The country also has a rule most EU countries do not have. Wages rise automatically when prices go up. Luxembourg’s national statistics office tracks the cost of living each month. When it climbs 2.5% within a set stretch of time, every paycheck in the country rises by that same amount. No employer negotiation is needed.
Non-wage costs are the taxes and social contributions an employer pays on top of a paycheck. In Luxembourg, they make up just 12.4% of the total labour cost, below the EU average of 24.7%. Luxembourg’s employers are not paying more into public programs than employers elsewhere. Their employees are simply paid more to begin with.
Bulgaria sits at the opposite end of the same wealth measure. Its GDP per capita is 68% of the EU average in 2025. It is tied with Greece for the lowest in the EU. The wealth gap between the two countries shows up almost directly in their labour costs.
France Puts More of Its Labour Cost Into Non-Wage Costs Than Germany
Germany’s hourly labour cost is €43.5. France’s is €43.4. The two numbers are nearly identical. France routes 32% of its labour cost into non-wage costs. Germany routes 23.5% into the same category.
France’s employer contributions fund a wider set of mandatory programs. They cover health insurance, pension contributions, and unemployment insurance. France also layers on several smaller levies, such as a housing assistance charge and an apprenticeship tax. Layering more mandatory programs onto the same paycheck raises the non-wage share without changing the total labour cost at all.
Labour cost alone does not say how a country pays for work. Two forces set the number:
- How wealthy the underlying economy is
- How much of that cost a government routes through mandatory contributions instead of the paycheck
Luxembourg and Bulgaria sit apart because of the first force. Germany and France sit close together despite splitting the second very differently.
More topics
- Top 25 Fastest-Growing Jobs in Germany
- Highest-Paying Ausbildung in Germany
- Highest Paying Jobs in Germany
- Which EU Countries Work From Home the Most?
- GDP of European Countries
- Which EU Country Recycles the Most?
- Energy Consumption for Cooling Has Doubled in the EU
- Which EU Country Has the Highest Cost of Living?
- EU Household Expenditure on Food and Non-Alcoholic Beverages
- EU Rent Price Index by Country Over Time
- Which EU Countries Had the Highest Inflation Rates?
- Minimum Wages Rose Fastest in Eastern Europe
- Which EU Countries Have the Highest Unemployment?
- The Best EU Countries to Retire In
- Most Prosperous EU Countries by Prosperity Index
References
- https://ec.europa.eu/eurostat/databrowser/view/lc_lci_lev/default/table?lang=en
- https://ec.europa.eu/eurostat/web/products-eurostat-news/w/ddn-20260331-2
- https://ec.europa.eu/eurostat/web/products-eurostat-news/w/ddn-20260325-1
- https://statistiques.public.lu/en/actualites/2026/stn19-26-ipc.html
- https://www.oecd.org/en/publications/taxing-wages-2026_3a5169ef-en/full-report/france_ad2bf5c9.html