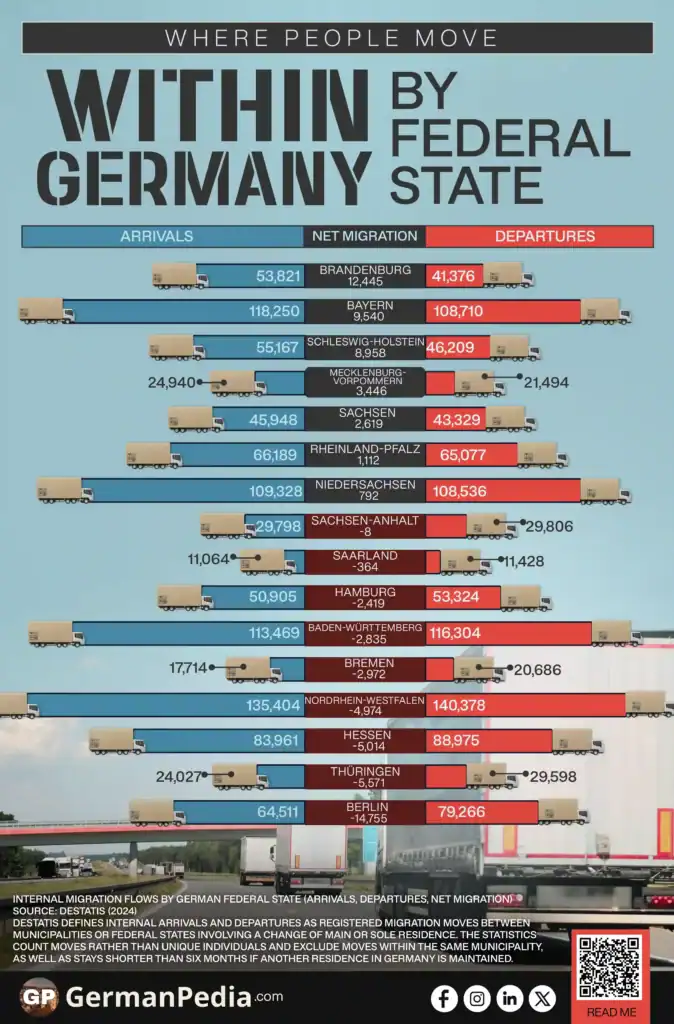
Visualize

Sick Leaves in Germany Doubled Since 2007

Sick Leaves in Germany Doubled Since 2007

Key Takeaways Average Sick Leave per Employee in Germany Year Average No. of Sick Leave (in working days) 1991 12.7 1992 12.7 1993 12.3 1994 12.4 1995 13.0 1996 12.0

Which German Cities Have the Highest STD Rates

Which German Cities Have the Highest STD Rates

Key Takeaways STD Cases in Germany by City Rank Region Number of incidences (per 100,000 individuals) Syphilis  Gonorrhea  HIV incidence  Total STD incidence  1 Berlin Friedrichshain-Kreuzberg 66.4 10.1 9.8 86.3

Employment by Federal State in Germany

Employment by Federal State in Germany

Key Takeaways Employment by Federal State in Germany Federal state Population (In Millions) Total employed Employees Self-employed Nordrhein-Westfalen 9.84 9.09 (92.4%) 0.75 (7.6%) Bayern 7.89 7.21 (91.4%) 0.68 (8.6%) Baden-Württemberg

Where Do Immigrants in Germany Come From

Where Do Immigrants in Germany Come From?

Key Takeaways First-Generation Immigrants in Germany Rank Country of birth Population (millions) 1 Poland 1.5 2 Türkiye 1.4 3 Ukraine 1.1 4 Russian Federation 1.0 5 Syria 1.0 6 Kazakhstan

Births Are Concentrated in a Few German States

Germany’s Live Births Per Federal State

Key Takeaways Germany’s Live Births per Federal State State Total Population (2023, in Mil.) Total birthsShare of total Total In % Nordrhein-Westfalen 18.19 152,688 22.5% Bayern 13.44 114,365 16.9% Baden-Württemberg

Scroll to Top