Key Takeaways
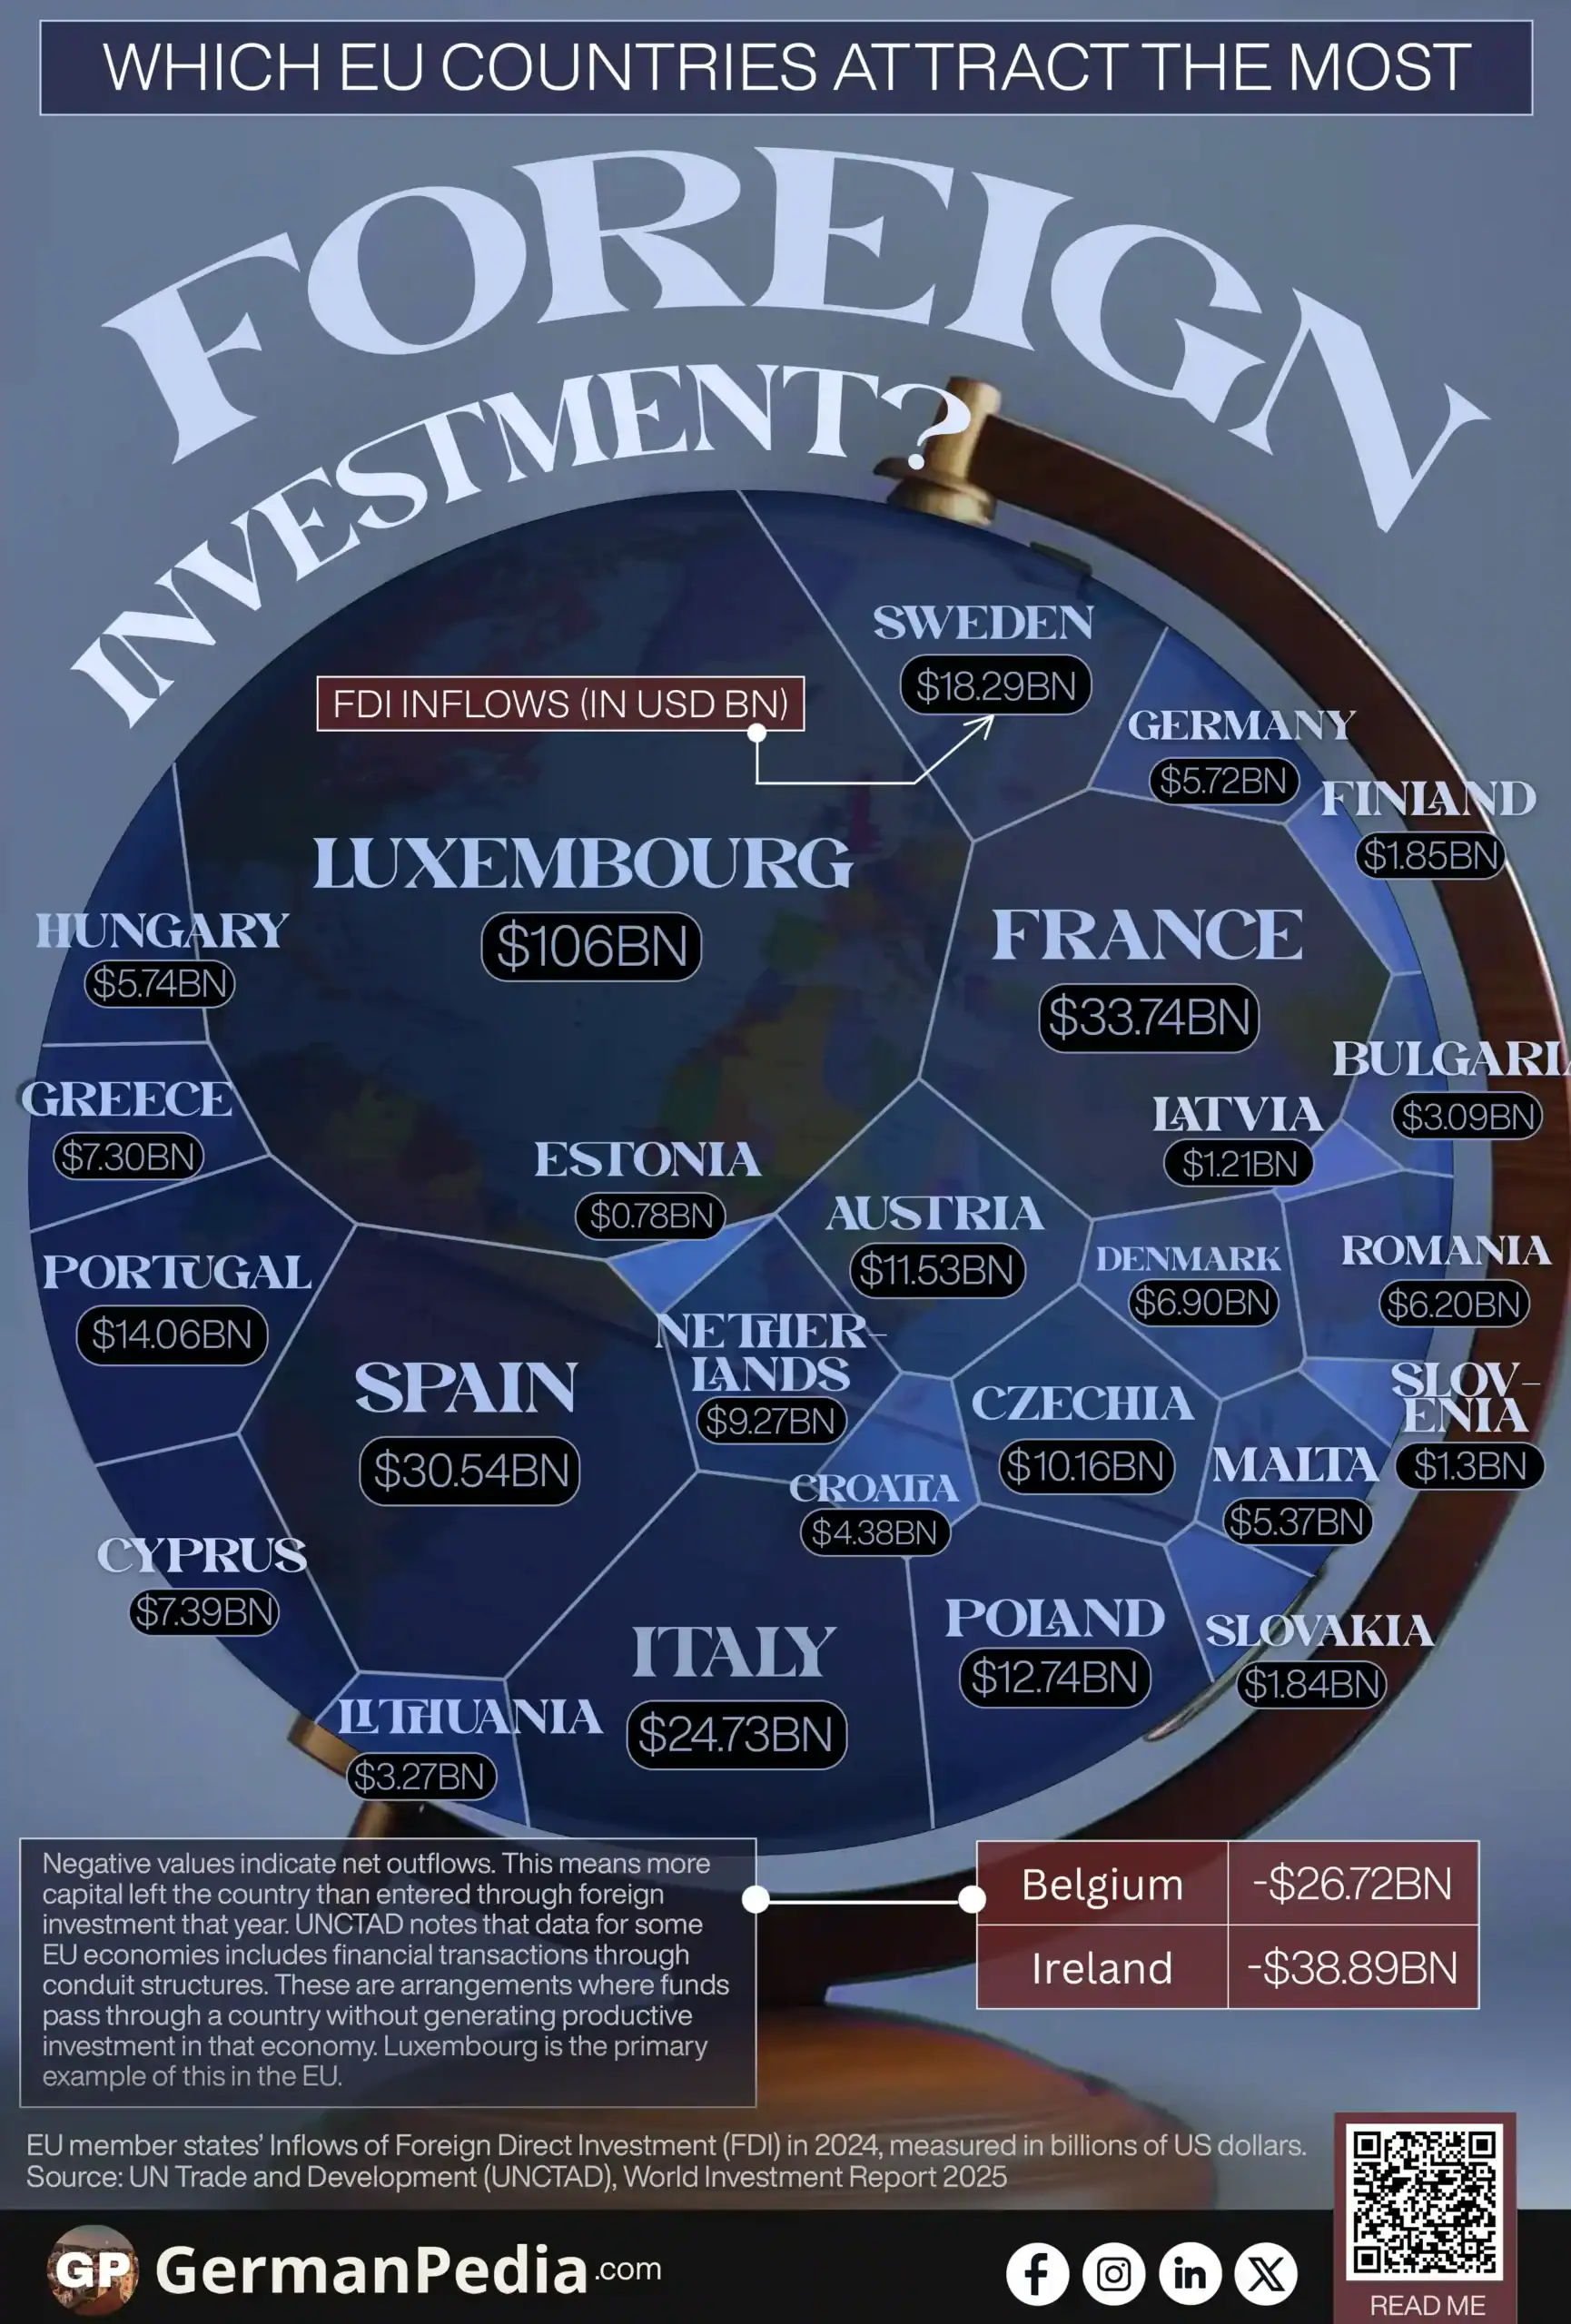
- Luxembourg tops the 2024 EU FDI ranking with $106 billion in inflows. Most of that figure reflects conduit flows. Money passes through Luxembourg holding structures to other destinations and does not represent productive investment in the country itself.
- France leads genuine productive FDI in the EU with $33.7 billion. Spain follows at $30.5 billion. Spain recorded the fastest growth in FDI projects among major EU economies in 2024.
- Germany attracted $5.7 billion in FDI inflows in 2024. That places the EU’s largest economy 16th in the ranking.
- Germany’s FDI inflows fell 89% in 2024. Geopolitical tensions, high borrowing costs, and industrial policy competition from the US and China drove the decline.
- Ireland recorded $38.9 billion in net outflows in 2024. Belgium recorded $26.7 billion in net outflows. Both figures reflect financial mechanics rather than investment collapse.
- Ireland’s negative figure stems from multinationals repatriating earnings to parent companies abroad. Belgium’s negative figure stems from resident affiliates extending loans to foreign parents.
Use this Visualization: You may use this image for free with proper attribution to GermanPedia (i.e., by linking back to GermanPedia).
Need help communicating complex ideas visually? We help you turn data into your most persuasive story. Contact us to learn more.
Foreign Direct Investment Inflows Across EU Countries
| Country | FDI Inflows (In USD bn) |
|---|---|
| Luxembourg | 106.00 |
| France | 33.74 |
| Spain | 30.54 |
| Italy | 24.73 |
| Sweden | 18.29 |
| Portugal | 14.06 |
| Poland | 12.74 |
| Austria | 11.53 |
| Czechia | 10.16 |
| Netherlands | 9.27 |
| Cyprus | 7.39 |
| Greece | 7.30 |
| Denmark | 6.90 |
| Romania | 6.20 |
| Hungary | 5.74 |
| Germany | 5.72 |
| Malta | 5.37 |
| Croatia | 4.38 |
| Lithuania | 3.27 |
| Bulgaria | 3.09 |
| Finland | 1.85 |
| Slovakia | 1.84 |
| Slovenia | 1.30 |
| Latvia | 1.21 |
| Estonia | 0.78 |
| Belgium | −26.72 |
| Ireland | −38.89 |
Source: UN Trade and Development (UNCTAD), World Investment Report 2025
Negative values indicate net outflows. This means more capital left the country than entered through foreign investment that year.
UNCTAD notes that data for some EU economies includes financial transactions through conduit structures. These are arrangements where funds pass through a country without generating productive investment in that economy. Luxembourg is the primary example of this in the EU.

Luxembourg tops the EU FDI ranking in 2024 with $106 billion in inflows. That figure is largely misleading. Luxembourg functions as a conduit economy: foreign capital enters, passes through holding structures, and exits to productive investments elsewhere. Global FDI fell 8% in 2024 when conduit flows through European economies like Luxembourg are stripped out. The real ranking starts one row below.
FDI inflows measure the money entering a country from foreign investors through equity purchases, reinvested earnings, and intercompany lending. They do not measure economic output or job creation on their own. Understanding that distinction matters for reading this table correctly.
France and Spain Lead Productive FDI in the EU
France attracted $33.7 billion in FDI inflows in 2024. It ranks first among EU economies with genuine productive investment. Spain follows at $30.5 billion. Spain recorded a 15% rise in FDI projects compared to 2023. That was the fastest growth rate among major EU economies that year.
Italy, Sweden, and Portugal round out the top five after Luxembourg is set aside. Sweden’s $18.3 billion places it ahead of larger economies, including Poland and Austria. Portugal, at $14.1 billion, ranks higher than Germany.
Germany Ranks 16th Despite Being the EU’s Largest Economy
Germany attracted $5.7 billion in FDI inflows in 2024. That places it 16th in the EU ranking.
Germany’s FDI inflows fell 89% in 2024 compared to the previous year. Three factors explain the decline:
- Geopolitical tensions and trade fragmentation led multinationals to prioritise risk management over long-term capital commitments.
- High borrowing costs reduced the appetite for new greenfield projects.
- Industrial policy competition from the United States and China drew investment away from Europe. Germany, as the EU’s most industrialised economy, absorbed a disproportionate share of that pullback.
Ireland and Belgium Show Negative Inflows for Structural Reasons
Ireland (−$38.9 bn.) and Belgium (−$26.7 bn.) recorded negative FDI inflows. Both figures reflect financial mechanics rather than investment collapse.
Ireland’s negative figure stems from large-scale earnings repatriation. Multinational companies based in Ireland transferred profits back to parent companies abroad. Those outflows exceeded new inflows, producing a net negative. Ireland remains one of Europe’s most active destinations for greenfield FDI projects by number and remains a hub for technology and pharmaceutical multinationals.
Belgium’s negative figure follows a different mechanism. Resident affiliates of foreign companies extended loans to their parent companies abroad. Those intercompany loans flow outward in the FDI accounts, creating a negative balance. The underlying business activity in Belgium did not contract.
Central and Eastern EU Countries Record Steady Inflows
Poland ($12.7bn), Czechia ($10.2bn), Romania ($6.2bn), Hungary ($5.7bn), and Croatia ($4.4bn) all recorded positive inflows. These economies have attracted consistent manufacturing and logistics investment driven by lower labour costs and EU market access.
The Baltic states recorded the lowest absolute inflows in the EU, ranging from $3.3 billion to $0.78 billion. These include Lithuania, Latvia, and Estonia. Their small population sizes explain the lower totals. As a share of GDP, their FDI intensity would rank higher.
The top of the EU FDI table in 2024 is dominated by conduit economics and repatriation mechanics. Strip those out, and the real picture is narrower. A handful of Western and Southern economies absorbed most genuine foreign capital. Central and Eastern Europe held steady. Germany, the bloc’s industrial anchor, recorded its weakest year in recent memory. The EU attracted investment in 2024, but not evenly, and not always where the headline numbers suggest.
More topics
- Leading EU Exporters and Importers of Digitally Delivered Services
- Countries Driving Germany’s Quarter Trillion Export Surplus
- Which EU Country Has the Highest Trade-to-GDP Ratio?
- EU Relies on Imports for Natural Gas
- Which EU Countries Had the Highest Inflation Rates?
- Which EU Countries Have the Highest Unemployment?
- US Oil Exports to the EU Are Highly Concentrated
- Most Prosperous EU Countries by Prosperity Index
- Average Working Hours in EU Countries
- Which EU Country Has the Highest Trade-to-GDP Ratio?
- Most Popular EU Tourist Destinations by Overnight Stays
- How Much Water Do EU Households Use?
- Where are Billionaires Concentrated in the EU?
- Which EU Countries Have the Most Soft Power?
- The Best EU Countries to Retire In