Key Takeaways
- Spain had the highest share of the labour force unemployed in the EU in both 2009 and 2025. Spain reduced its share from 17.9% to 10.5%. No other EU country cut its figure by more over the same period.
- The EU average fell from 9.3% in 2009 to 6.0% in 2025. The total number of unemployed workers dropped from 19 million to 13 million.
- The Baltic states made the steepest recoveries in the EU. Latvia fell from 17.7% to 6.9%, Lithuania from 13.8% to 6.9%, and Estonia from 13.5% to 7.5%. Internal devaluation, export-led growth, and emigration drove the recovery.
- Czechia reached 2.8% in 2025, the lowest share in the EU. Poland fell to 3.1%, Germany to 3.8%, and the Netherlands to 3.9%.
- Finland moved against the EU trend. Its share rose from 8.3% in 2009 to 9.7% in 2025. Pension and benefit reforms expanded the labour force faster than the economy added jobs.
- Spain’s reliance on temporary contracts in seasonal sectors kept its unemployment share structurally high. A 2022 labour reform restricted temporary hiring. Spain’s share remained the highest in the EU three years after the reform passed.
Use this Visualization: You may use this image for free with proper attribution to GermanPedia (i.e., by linking back to GermanPedia).
Need help communicating complex ideas visually? We help you turn data into your most persuasive story. Contact us to learn more.
Unemployment in EU Countries
| Country | Unemployed persons (In thousands, as % of labour force) | |
|---|---|---|
| 2009 | 2025 | |
| EU-27 | 19,271 (9.3%) | 13,302 (6.0%) |
| Spain | 4,154 (17.9%) | 2,608 (10.5%) |
| Finland | 221 (8.3%) | 278 (9.7%) |
| Greece | 491 (9.8%) | 422 (8.9%) |
| Sweden | 412 (8.5%) | 510 (8.8%) |
| France | 2,651 (9.1%) | 2,433 (7.7%) |
| Estonia | 93 (13.5%) | 56 (7.5%) |
| Latvia | 194 (17.7%) | 66 (6.9%) |
| Lithuania | 211 (13.8%) | 108 (6.9%) |
| Luxembourg | 12 (5.1%) | 23 (6.5%) |
| Denmark | 186 (6.4%) | 209 (6.4%) |
| Belgium | 383 (8.0%) | 339 (6.2%) |
| Italy | 1,921 (7.9%) | 1,576 (6.1%) |
| Romania | 694 (8.4%) | 500 (6.1%) |
| Portugal | 573 (11.2%) | 337 (6.0%) |
| Austria | 239 (5.7%) | 270 (5.7%) |
| Slovakia | 332 (12.0%) | 150 (5.4%) |
| Croatia | 173 (9.1%) | 87 (4.9%) |
| Ireland | 291 (12.6%) | 137 (4.7%) |
| Hungary | 417 (9.7%) | 216 (4.4%) |
| Cyprus | 22 (5.4%) | 23 (4.4%) |
| Netherlands | 490 (5.4%) | 396 (3.9%) |
| Slovenia | 61 (5.9%) | 40 (3.9%) |
| Germany | 3,003 (7.3%) | 1,692 (3.8%) |
| Bulgaria | 276 (7.9%) | 107 (3.5%) |
| Poland | 1,409 (8.5%) | 558 (3.1%) |
| Malta | 12 (6.9%) | 10 (3.1%) |
| Czechia | 352 (6.7%) | 151 (2.8%) |
Source: Eurostat
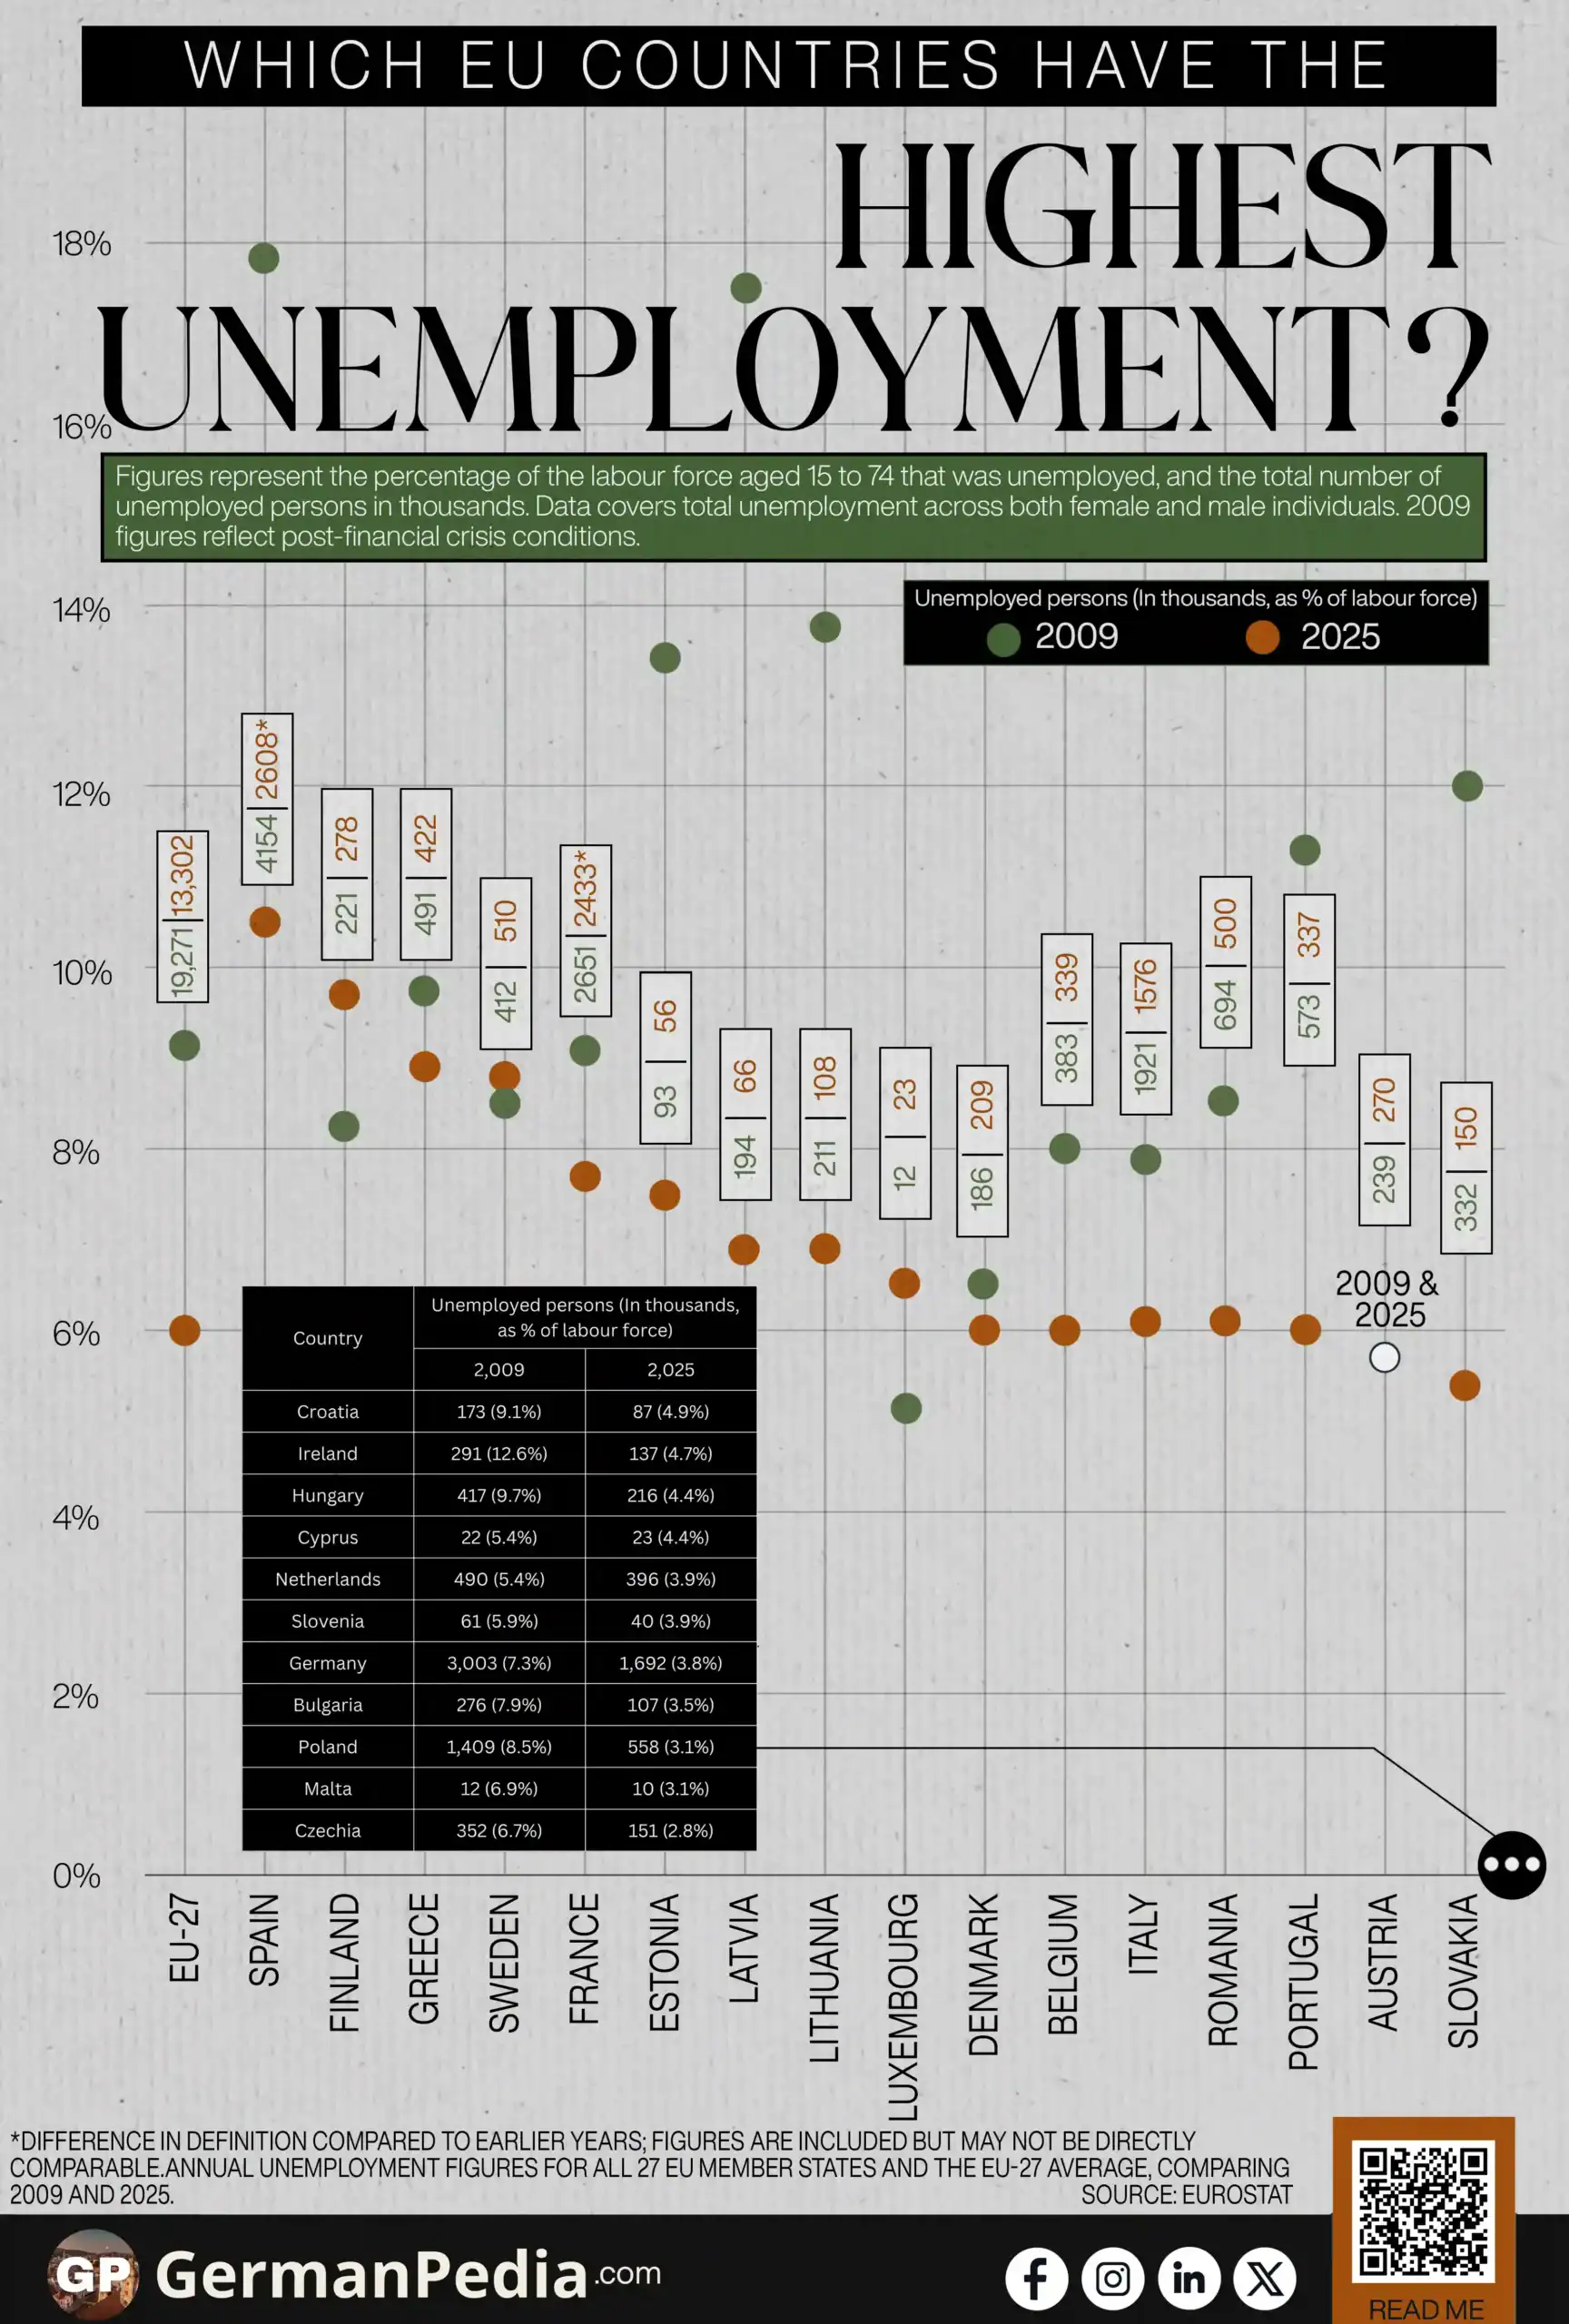
Figures represent the percentage of the labour force aged 15 to 74 that was unemployed, and the total number of unemployed persons in thousands. Data covers total unemployment across both female and male individuals. 2009 figures reflect post-financial crisis conditions.
*Difference in definition compared to earlier years; figures are included but may not be directly comparable.

Across the EU, the share of the labour force unemployed fell from 9.3% in 2009 to 6.0% in 2025. The total number of unemployed workers dropped from 19 million to 13 million. Those figures describe a broad recovery. They do not describe a uniform one.
The 2009 figures reflect the aftermath of the financial crisis that began in 2008, which pushed unemployment sharply higher across the bloc. Countries that started highest in 2009 had the most room to fall.
The Baltic States Made the Steepest Reduction in EU Unemployment
Latvia, Lithuania, and Estonia entered 2009 with the highest shares in the EU. Latvia had 17.7% of its labour force unemployed. Lithuania had 13.8%. Estonia had 13.5%. Latvia’s output contracted by 21% between 2008 and 2009. Estonia’s fell by 18%.
Recovery came through export-led growth. Governments also pursued a process called internal devaluation. Rather than devalue their currencies, the Baltic states cut public spending and wages to restore price competitiveness. Emigration reduced the size of the measured labour force. A smaller labour force lowered the unemployment share faster than job creation alone could account for.
By 2025, Latvia had fallen to 6.9%. Lithuania reached 6.9%. Estonia reached 7.5%. All three remained above the EU average of 6.0%. The reduction over 16 years was the largest in the bloc.
Several Central and Eastern EU countries also improved substantially over the same period:
- Poland: 8.5% → 3.1%
- Czechia: 6.7% → 2.8%
- Slovakia: 12.0% → 5.4%
- Hungary: 9.7% → 4.4%
Czechia reached 2.8% in 2025, the lowest share in the EU. Germany fell from 7.3% to 3.8%. Germany ranked among the five lowest in the EU by 2025, alongside Czechia, Poland, Slovenia, and the Netherlands.
Finland’s Share of the Labour Force Unemployed Rose Between 2009 and 2025
Finland moved against the EU-wide direction. Its share rose from 8.3% in 2009 to 9.7% in 2025. Finland ranked among the highest in the EU by 2025, alongside Spain and Greece.
The rise does not reflect a collapse in employment. Finland’s labour force participation grew over the same period. Reforms to pension entitlements and unemployment benefits brought more workers into the active labour force. Finland’s labour force grew faster than its economy added jobs. Weak economic growth from 2023 onwards limited demand for workers. The unemployment share rose as a result.
Sweden also ended 2025 with a higher share than in 2009, rising from 8.5% to 8.8%. Luxembourg rose from 5.1% to 6.5%.
Spain Improved More Than Any Other EU Country and Still Ranked Highest
Spain had the highest share in 2009 at 17.9%. By 2025 that figure had fallen to 10.5%. No other EU country reduced its share by as many percentage points over the same period.
Spain still ranked highest in the EU in 2025. The structural conditions that drove the 2009 figure have not been resolved. Spain’s labour market concentrates employment in seasonal sectors such as tourism and construction. Most hiring in these sectors is done on temporary contracts. Workers on temporary contracts are the first to lose employment in a downturn. They are also the last to be rehired when conditions improve. A 2022 labour market reform restricted the use of temporary contracts. Spain’s share remained the highest in the EU three years later.
The structural conditions that explain the remaining gaps did not change substantially between 2009 and 2025. Spain’s labour market still amplifies every economic downturn through its reliance on temporary contracts. Finland’s labour force grew faster than its economy could absorb. Central and Eastern EU countries converged toward and, in some cases, below the EU average. Economic growth drove most of this shift. In the Baltic states, emigration also reduced the measured labour force and accelerated the fall.
More topics
- Minimum Wages Rose Fastest in Eastern Europe
- EU Wage Growth In The Last Two Decades
- Germany’s Median Wage by Federal State
- The Best EU Countries to Retire In
- Employment in the EU Is Shifting Toward Higher Education
- Employment by Federal State in Germany
- Which EU Countries Have the Most Soft Power?
- Foreign-Born Population in the EU Is Rising
- EU Old-Age Dependency Ratio by Country
- Government Spending on Education in EU Countries
- Which EU Cities Have the Most Millionaires?
- Which Are the Busiest Airports in the EU?
- EU Passports Are Among the Strongest in the World
- EU Countries With the Most Greenhouse Gas Emissions
- EU Alternatives to Common US Platforms
References
- https://ec.europa.eu/eurostat/databrowser/view/une_rt_a__custom_21547466/default/table
- https://ec.europa.eu/eurostat/statistics-explained/index.php?title=Unemployment_statistics
- https://www.bofbulletin.fi/en/2025/6/finland-s-labour-market-weaker-than-that-of-the-euro-area/
- https://izajoels.springeropen.com/articles/10.1186/2193-9012-2-4
- https://www.caixabankresearch.com/en/economics-markets/labour-market-demographics/how-could-structural-unemployment-be-further-reduced