Key Takeaways
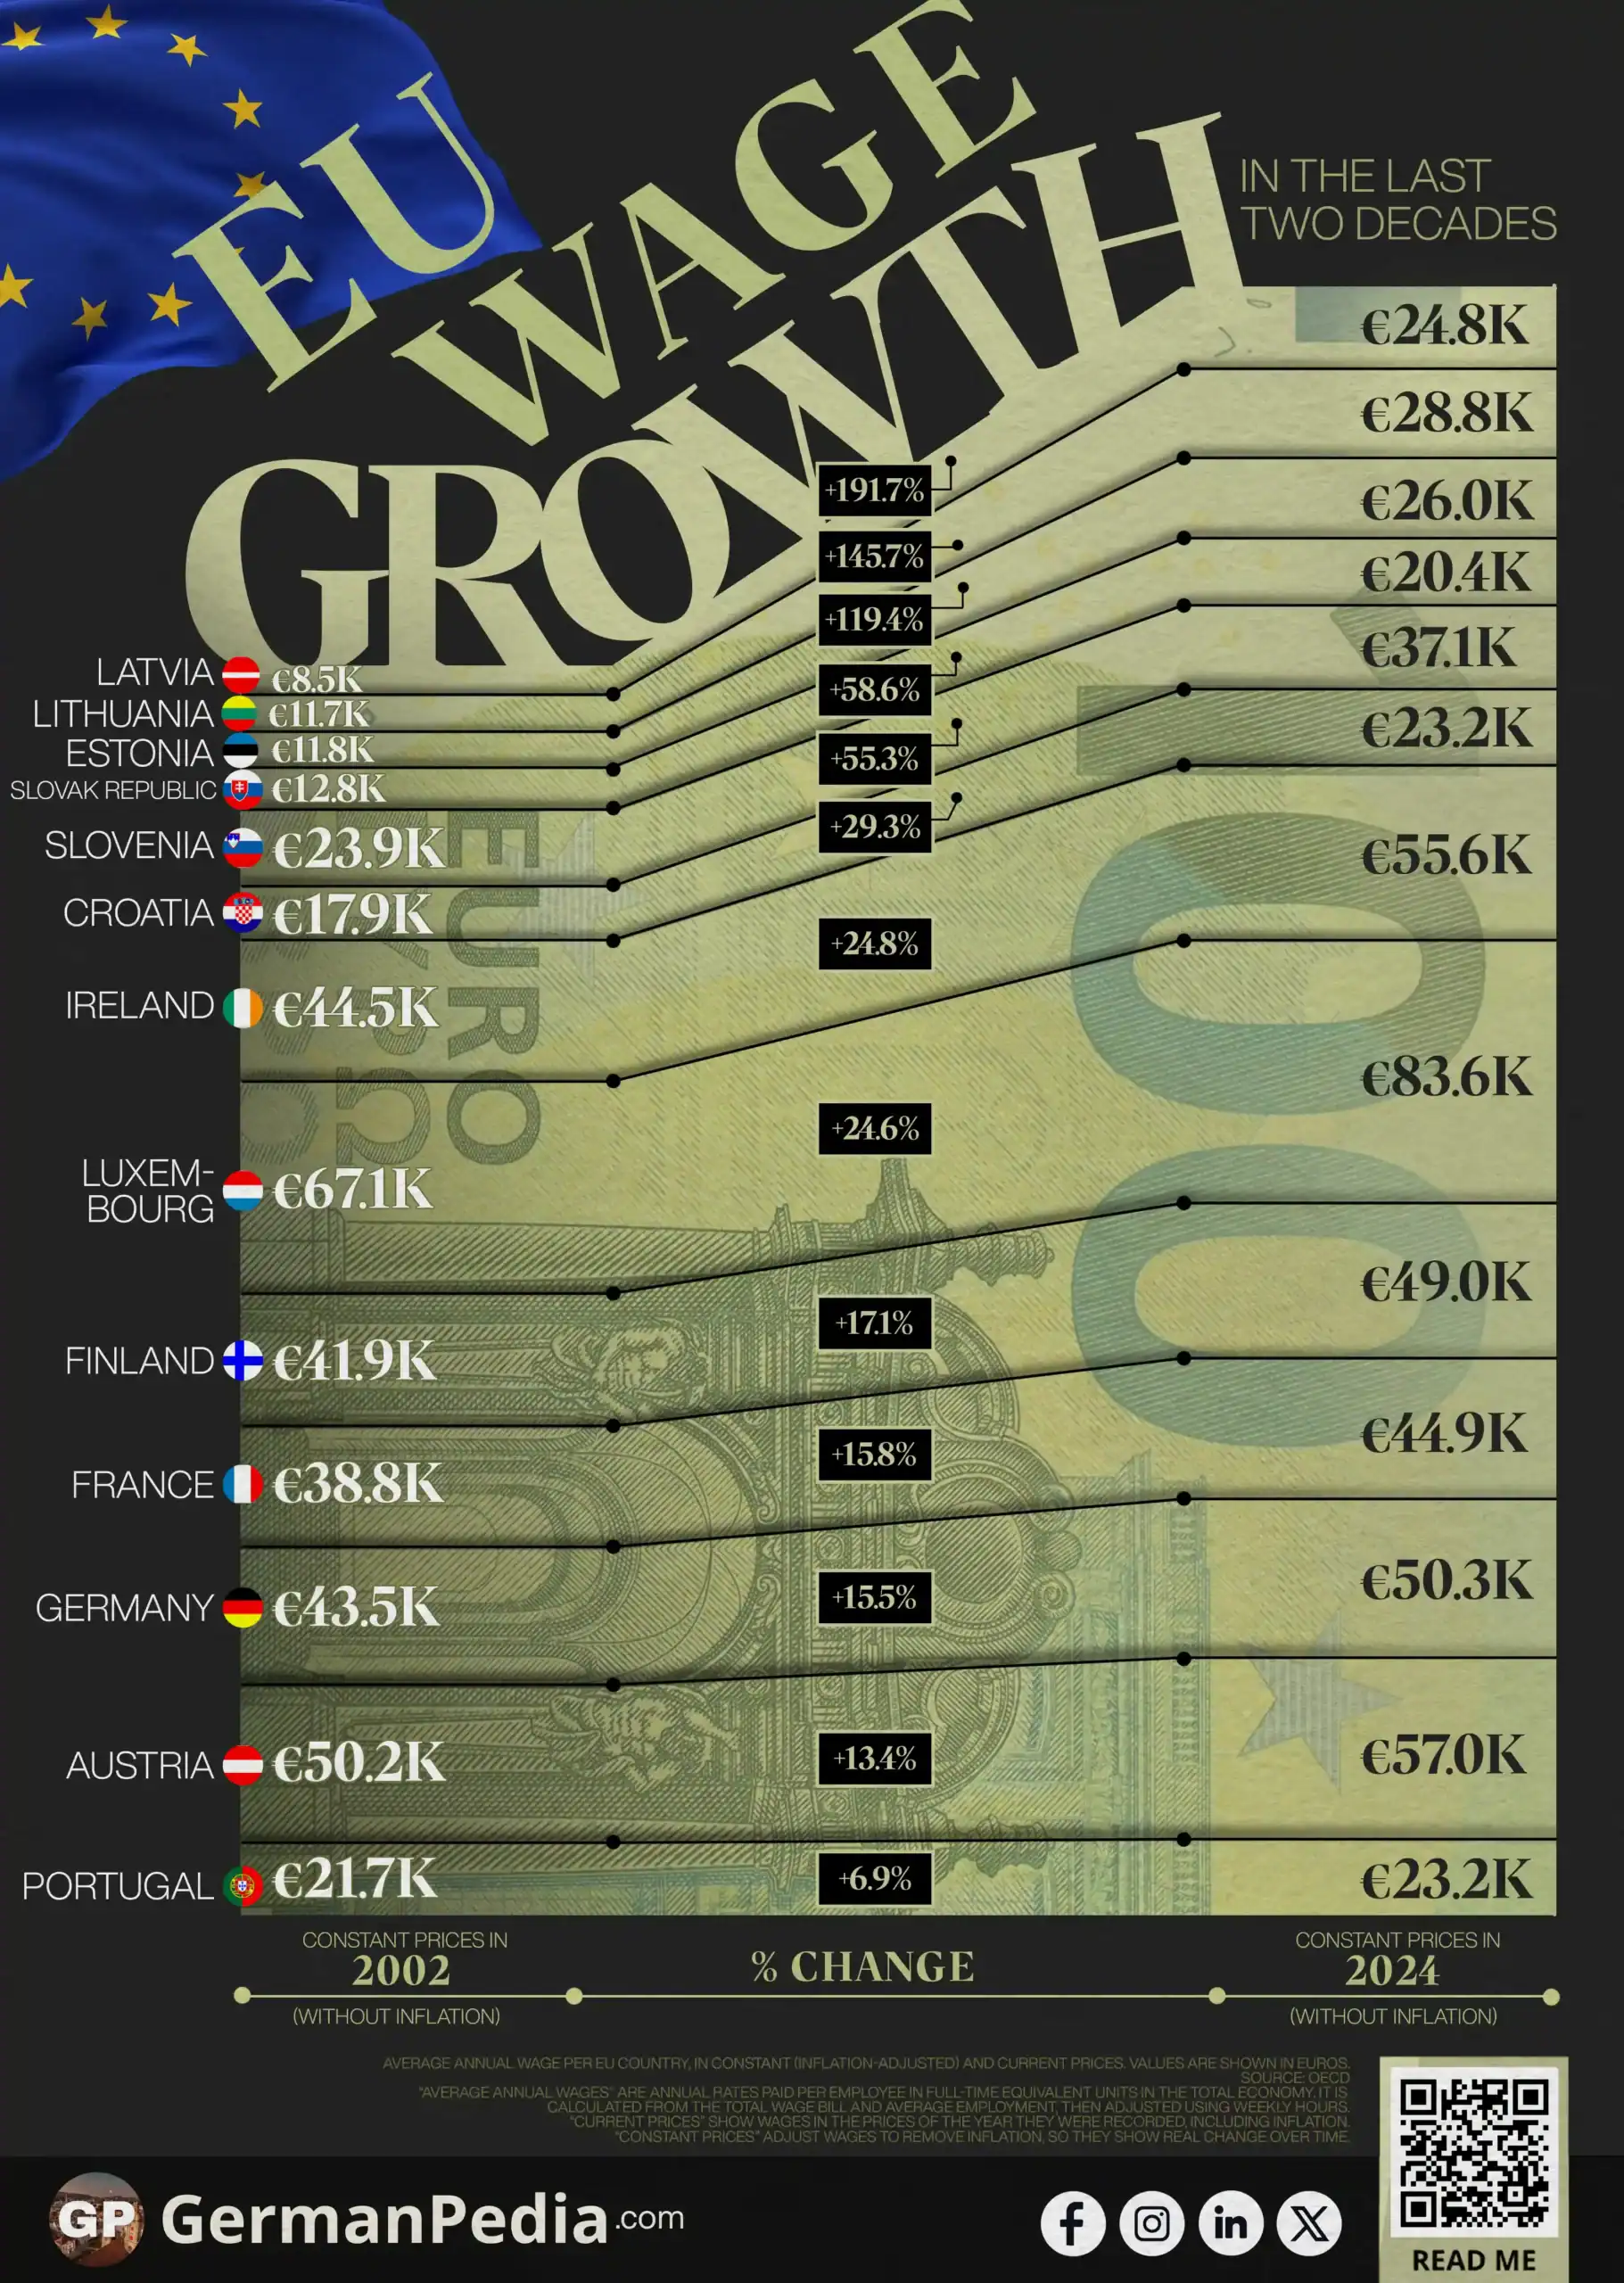
- Latvia (+191.7%), Lithuania (+145.7%), and Estonia (+119.4%) recorded the fastest growth in wages at constant prices, reflecting a catch-up pattern from lower wage levels
- In Western Europe, including Germany, France, and Austria, wage growth in constant prices was more moderate due to already higher wage levels.
- In Southern Europe, growth in wages at constant prices was weaker, with declines in Greece (−2.3%) and Italy (−16.8%), reflecting structural factors such as low productivity growth and the long-term effects of the eurozone crisis.
- Across the countries shown, nominal wage growth is consistently higher than real wage growth, highlighting the impact of inflation over time.
- Over time, wage growth in the EU shows gradual convergence, but differences in local economic conditions mean countries are catching up at different speeds.
Use this Visualization: You may use this image for free with proper attribution to GermanPedia (i.e., by linking back to GermanPedia).
Need help communicating complex ideas visually? We help you turn data into your most persuasive story. Contact us to learn more.
EU Annual Wage Growth
| Country | Constant Prices (In € thousands) | Current Prices (In € thousands) | ||
|---|---|---|---|---|
| 2002 / 2024 | % Change | 2002 / 2024 | % Change | |
| Latvia | 8.5 / 24.8 | +191.7% | 4.3 / 24.8 | +472.7% |
| Lithuania | 11.7 / 28.8 | +145.7% | 6.6 / 28.8 | +336.7% |
| Estonia | 11.8 / 26.0 | +119.4% | 6.2 / 26.0 | +320.2% |
| Slovak Republic | 12.8 / 20.4 | +58.6% | 7.3 / 20.4 | +177.7% |
| Slovenia | 23.9 / 37.1 | +55.3% | 15.9 / 37.1 | +133.9% |
| Croatia | 17.9 / 23.2 | +29.3% | 11.5 / 22.9 | +99.5% |
| Ireland | 44.5 / 55.6 | +24.8% | 34.9 / 55.6 | +59.3% |
| Luxembourg | 67.1 / 83.6 | +24.6% | 45.5 / 83.6 | +83.9% |
| Finland | 41.9 / 49.0 | +17.1% | 32.0 / 49.0 | +53.2% |
| France | 38.8 / 44.9 | +15.8% | 29.0 / 44.9 | +55.0% |
| Germany | 43.5 / 50.3 | +15.5% | 30.2 / 50.3 | +66.5% |
| Austria | 50.2 / 57.0 | +13.4% | 29.2 / 57.0 | +94.9% |
| Portugal | 21.7 / 23.2 | +6.9% | 14.4 / 23.2 | +60.7% |
| Belgium | 55.6 / 59.1 | +6.3% | 34.3 / 59.1 | +72.0% |
| Spain | 31.4 / 33.0 | +5.1% | 20.7 / 33.0 | +59.8% |
| Netherlands | 56.7 / 58.2 | +2.7% | 36.9 / 58.2 | +57.8% |
| Italy | 33.9 / 33.1 | −2.3% | 24.1 / 33.1 | +37.7% |
| Greece | 22.2 / 18.5 | −16.8% | 18.3 / 18.5 | +0.8% |
Source: OECD
“Average annual wages” are annual rates paid per employee in full-time equivalent units in the total economy. It is calculated from the total wage bill and average employment, then adjusted using weekly hours.
“Current prices” show wages in the prices of the year they were recorded, including inflation.
“Constant prices” adjust wages to remove inflation, so they show real change over time.

Between 2002 and 2024, wages increased across most of the EU countries, but the improvements differ a lot depending on how you measure them.
Wages are shown in two ways:
- Current prices: these include inflation.
- Constant prices: these are adjusted for inflation and show real wage growth.
That’s why current prices usually show bigger gains, while constant prices give a clearer picture of changes in purchasing power.
Actual Consumption per Capita vs GDP Per Capita in the EU ->
The strongest increases in real wages were recorded in Eastern Europe, particularly the Baltic states:
- Latvia: 8.5 → 24.8 (+191.7%)
- Lithuania: 11.7 → 28.8 (+145.7%)
- Estonia: 11.8 → 26.0 (+119.4%)
In current prices, the increases are even larger:
- Latvia: +472.7%
- Lithuania: +336.7%
- Estonia: +320.2%
This gap shows the effect of inflation on wage growth in current prices. Even so, wages in constant prices rose strongly, which is consistent with a catch-up pattern where lower-wage economies grow faster as they converge toward richer countries.
Several verified factors help explain this trend:
- Tight labor markets contributed to wage growth.
- Foreign investment and foreign-owned firms supported labor demand and productivity in parts of the region.
- In the Baltic states, emigration helped tighten labor markets and add upward pressure on wages in some cases.
These patterns suggest that strong wage growth in constant prices can reflect convergence from a lower base, rather than an already high income level.
In Western Europe, wage growth in constant prices was more moderate than in the Baltic states:
- Germany: 43.5 → 50.3 (+15.5%)
- France: 38.8 → 44.9 (+15.8%)
- Austria: 50.2 → 57.0 (+13.4%)
In current prices, these increases are higher, often between 55% and 95%, reflecting the impact of inflation over time.
These countries also started from higher wage levels, so percentage gains are naturally smaller. As a result, wage growth in constant prices appears more gradual, even where current-price increases look much stronger.
In parts of Southern Europe, wage growth in constant prices was weaker, especially in Greece (−16.8%) and Italy (−2.3%), while Spain (+5.1%) and Portugal (+6.9%) saw only modest gains.
These countries were facing weaker economic conditions than faster-growing parts of Europe, reflecting several factors:
- Low productivity growth: output per worker was rising slowly, which limited room for wage increases.
- Insufficient investment: weak capital accumulation has held back productivity and long-term growth.
- Demographic decline: an aging or shrinking population weakens long-term economic momentum.
- The eurozone crisis and the long recovery that followed weighed heavily on Southern Europe, especially Greece.
Overall, these patterns show that the annual wage growth across the EU is converging. However, regional differences play a part in the pace and direction of that convergence.
More topics
- GDP per Capita vs Actual Consumption per Capita in the EU
- Net Household Saving Rates in the EU Over Time
- Where are Billionaires Concentrated in the EU?
- Happiness vs Income in the EU
- Which Countries Use AI the Most in the EU?
- Electric and Hybrid Cars in the EU: Who Is Leading the Shift?
- Claude Usage in the EU: Which Countries Lead and Why?
- Petrol Prices Are Rising Across the EU
- Top 13 Most Valuable Brands in the EU
- EU Countries with the Most U.S. Troops
- Where are Billionaires Concentrated in the EU?
- Employment by Federal State in Germany
- Foreign-Born Population in the EU Is Rising
- Top EU Countries Where People Say They Don’t Need AI
- EU Alternatives to Common US Platforms
- Most Surveilled Major Cities in the EU
- EU Air Forces Differ in Fighter Aircraft and Priorities
References
- https://data-explorer.oecd.org/vis?tm=average+annual+wage&pg=0&snb=26&vw=tb&df[ds]=dsDisseminateFinalDMZ&df[id]=DSD_EARNINGS%40AV_AN_WAGE&df[ag]=OECD.ELS.SAE&df[vs]=1.0&dq=AUT%2BBEL%2BBGR%2BHRV%2BROU%2BCZE%2BDNK%2BEST%2BFIN%2BFRA%2BDEU%2BGRC%2BHUN%2BIRL%2BITA%2BLVA%2BLTU%2BLUX%2BNLD%2BPOL%2BPRT%2BSVN%2BSVK%2BESP%2BSWE..EUR..Q..&pd=1990%2C2024&to[TIME_PERIOD]=false&ly[cl]=TIME_PERIOD&ly[rw]=REF_AREA
- https://www.oecd.org/en/data/indicators/average-annual-wages.html
- https://www.ecb.europa.eu/pub/pdf/other/ebbox201705_01.en.pdf
- https://d-nb.info/1097336476/34
- https://economic-research.bnpparibas.com/html/en-US/Southern-Europe-such-potential-growth-30/11/2020,39584
- https://www.cambridge.org/core/journals/european-journal-of-political-research/article/stateled-wage-devaluation-in-southern-europe-in-the-wake-of-the-eurozone-crisis/B1DAA475EEC6A7AA5CF4C29EDA87A862