
Key Takeaways
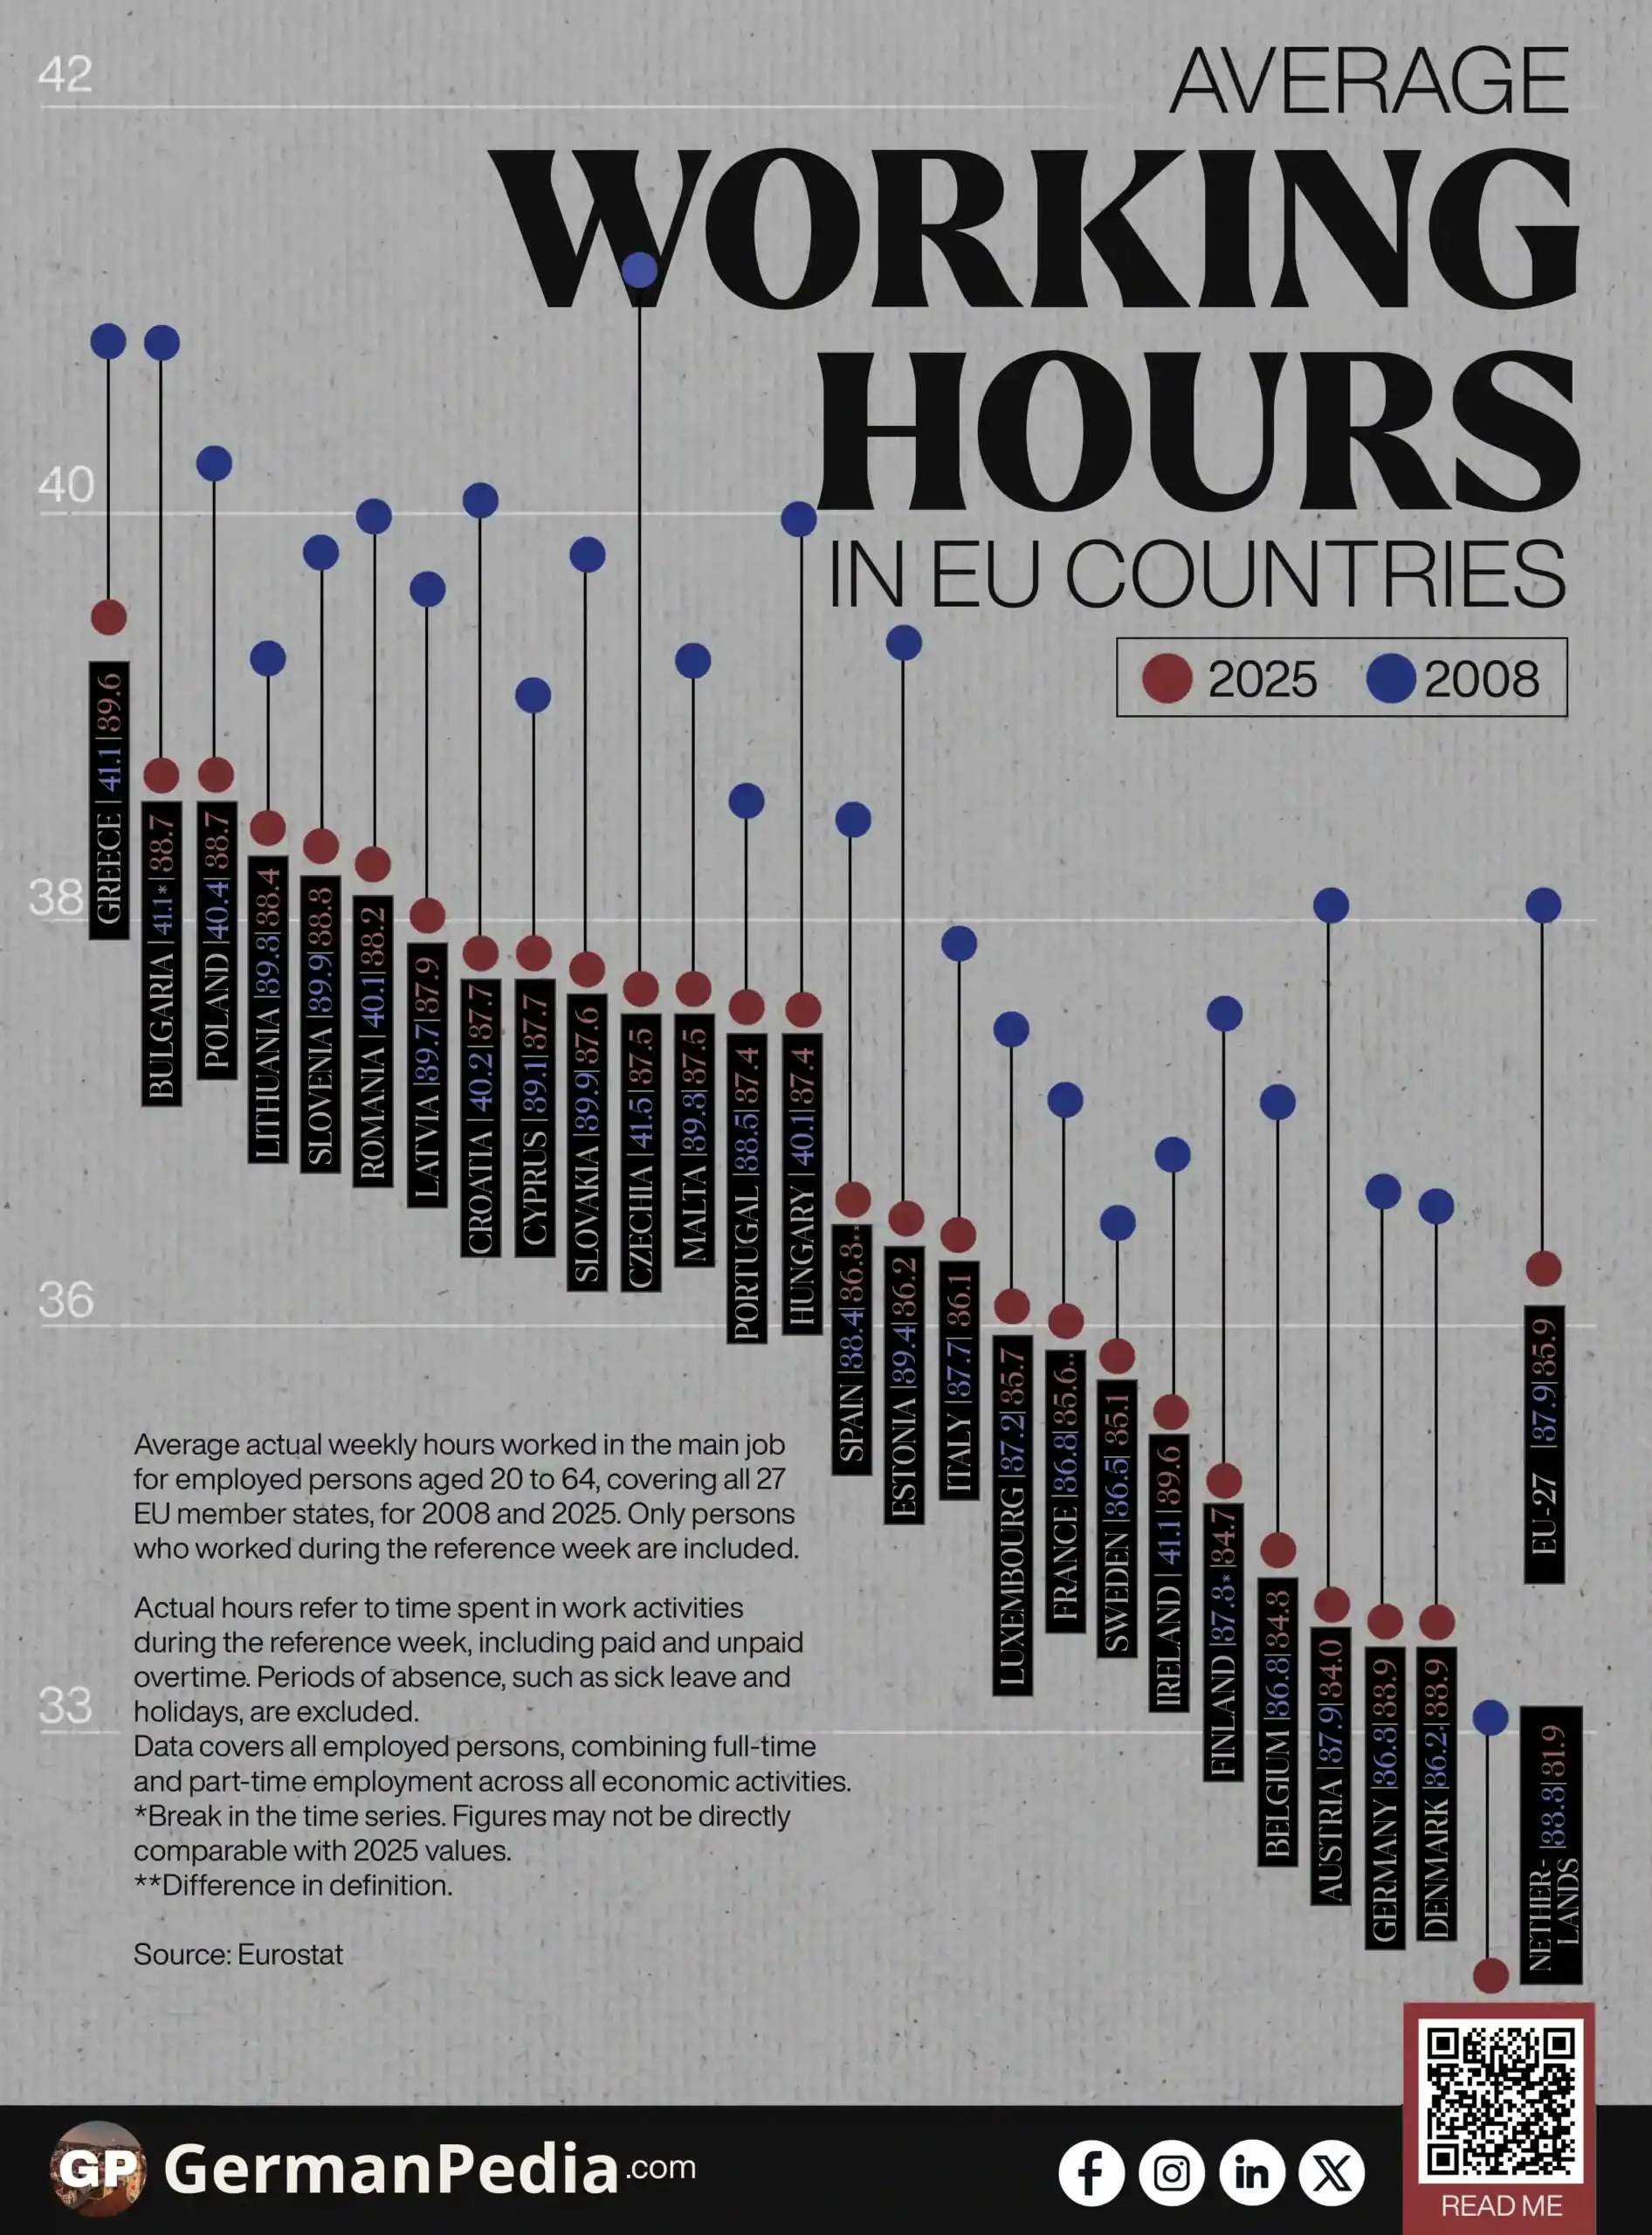
- Greece recorded the longest actual working week in the EU in 2025 at 39.6 hours. A high share of self-employed workers and below-average wages keep its hours consistently above all other EU countries.
- Every EU country reduced actual working hours between 2008 and 2025. The EU average fell from 37.9 to 35.9 hours over 17 years.
- In 2025, Central and Eastern EU countries filled every position in the top 10. Lower wages and a smaller share of part-time employment keep national averages higher than in Western and Northern EU countries.
- Czechia recorded the steepest reduction in actual working hours in the EU. It fell 4.0 hours from 41.5 to 37.5. Rising part-time employment was the primary driver of falling hours across the EU.
- The Netherlands recorded the shortest actual working week in the EU at 31.9 hours. Approximately 39% of Dutch workers are employed part-time, the highest rate among OECD countries.
- Germany and Denmark both recorded 33.9 actual hours per week. Both ranked among the EU’s lowest despite being among its most productive economies by output per worker.
Use this Visualization: You may use this image for free with proper attribution to GermanPedia (i.e., by linking back to GermanPedia).
Need help communicating complex ideas visually? We help you turn data into your most persuasive story. Contact us to learn more.
Actual Weekly Hours Worked Across EU Countries
| Country | Weekly Working Hours | |
|---|---|---|
| 2008 | 2025 | |
| Greece | 41.1 | 39.6 |
| Bulgaria | 41.1* | 38.7 |
| Poland | 40.4 | 38.7 |
| Lithuania | 39.3 | 38.4 |
| Slovenia | 39.9 | 38.3 |
| Romania | 40.1 | 38.2 |
| Latvia | 39.7 | 37.9 |
| Croatia | 40.2 | 37.7 |
| Cyprus | 39.1 | 37.7 |
| Slovakia | 39.9 | 37.6 |
| Czechia | 41.5 | 37.5 |
| Malta | 39.3 | 37.5 |
| Portugal | 38.5 | 37.4 |
| Hungary | 40.1 | 37.4 |
| Spain | 38.4 | 36.3** |
| Estonia | 39.4 | 36.2 |
| Italy | 37.7 | 36.1 |
| Luxembourg | 37.2 | 35.7 |
| France | 36.8 | 35.6** |
| Sweden | 36.1 | 35.4 |
| Ireland | 36.5 | 35.1 |
| Finland | 37.3* | 34.7 |
| Belgium | 36.8 | 34.3 |
| Austria | 37.9 | 34.0 |
| Germany | 36.3 | 33.9 |
| Denmark | 36.2* | 33.9 |
| Netherlands | 33.3 | 31.9 |
| EU-27 | 37.9 | 35.9 |
Source: Eurostat
Actual hours refer to time spent in work activities during the reference week, including paid and unpaid overtime. Periods of absence, such as sick leave and holidays, are excluded.
Data covers all employed persons, combining full-time and part-time employment across all economic activities.
*Break in the time series. Figures may not be directly comparable with 2025 values.
**Difference in definition.

The average EU worker put in 2.0 fewer actual working hours per week in 2025 than in 2008. However, the reductions were uneven. The structural divide between the EU’s longest and shortest working nations has barely shifted.
Greece and Eastern EU Work the Longest Actual Working Hours
Greece had the longest actual working hours in the EU for both 2008 and 2025. It reached 39.6 actual hours per week in 2025.
Greece has a high share of self-employed workers. Self-employed workers set their own hours and receive no overtime pay. They tend to log more hours per week than employees, pulling the national average higher. Greek wages also sit below the EU average. Lower pay creates pressure to work longer.
Beyond Greece, Eastern EU countries dominate the upper tier of actual weekly working hours. Three countries stood above 38.5 hours in 2025:
- Bulgaria: 38.7 hours (2008: 41.1)
- Poland: 38.7 hours (2008: 40.4)
- Lithuania: 38.4 hours (2008: 39.3)
Central and Eastern EU countries have lower average wages than their Western and Northern counterparts. Part-time work is also far less common in these countries. In Poland, Romania, and Czechia, most workers are employed full-time. Fewer workers on shorter schedules keep the national average higher.
Czechia and Austria Reduced Actual Working Hours the Most in the EU
Every EU country reduced actual working hours between 2008 and 2025. Czechia recorded the steepest drop. It fell 4.0 hours from 41.5 to 37.5. Austria followed with a reduction of 3.9 hours. Estonia fell 3.2 hours.
Rising part-time employment is the primary driver of falling average actual working hours across the EU. The shift was fastest in Central and Eastern EU countries, where part-time rates were low at the start of the period. This is where the biggest reductions occurred.
Sweden recorded the smallest change, falling just 0.7 hours from 36.1 to 35.4.
The Netherlands, Germany, and Denmark Have the Shortest Working Weeks in the EU
The Netherlands recorded the shortest actual working week in the EU in 2025 at 31.9 hours per week. This sits 4.0 hours below Denmark and Germany. Both countries follow at 33.9 actual hours per week.
The Netherlands has the highest part-time employment rate among OECD countries. Approximately 39% of Dutch workers were in part-time roles as of 2024. The Netherlands also offers comprehensive social welfare benefits to part-time workers. This means part-time workers can reduce hours without a proportional loss in income or benefits. Part-time becomes a viable long-term choice rather than a temporary arrangement.
Germany and Denmark offer a sharper contrast. Both Germany and Denmark rank among the EU’s most productive economies by output per worker. Both were placed near the bottom of the EU’s actual working hours ranking in 2025.
The pattern across 17 years is consistent. Countries with higher wages, stronger labor protections, and widespread part-time options cluster at the bottom of the actual working hours ranking. Countries with lower wages and limited part-time coverage cluster at the top. Both groups have shortened their working weeks since 2008. The distance between them has not.
More topics
- Minimum Wages Rose Fastest in Eastern Europe
- EU Wage Growth In The Last Two Decades
- Germany’s Median Wage by Federal State
- The Best EU Countries to Retire In
- Employment in the EU Is Shifting Toward Higher Education
- Employment by Federal State in Germany
- Which EU Countries Have the Most Soft Power?
- Foreign-Born Population in the EU Is Rising
- EU Old-Age Dependency Ratio by Country
- Government Spending on Education in EU Countries
- EU Relies on Imports for Natural Gas
- US Oil Exports to the EU Are Highly Concentrated
- EU Passports Are Among the Strongest in the World
- EU Rent Price Index by Country Over Time
- EU Alternatives to Common US Platforms
References
- https://ec.europa.eu/eurostat/databrowser/view/lfsa_ewhan2/default/table?lang=en
- https://www.euronews.com/business/2025/06/13/why-and-where-are-weekly-working-hours-dropping-in-europe
- https://www.imf.org/en/Publications/WP/Issues/2024/01/10/Dissecting-the-Decline-in-Average-Hours-Worked-in-Europe-542417
- https://www.mynewsdesk.com/eurofound/news/workers-in-central-and-eastern-eu-have-longer-working-hours-and-shorter-leave-entitlements-475017
- https://www.euronews.com/2025/10/17/greeces-parliament-approves-bill-extending-working-hours-despite-nationwide-protests