Key Takeaways
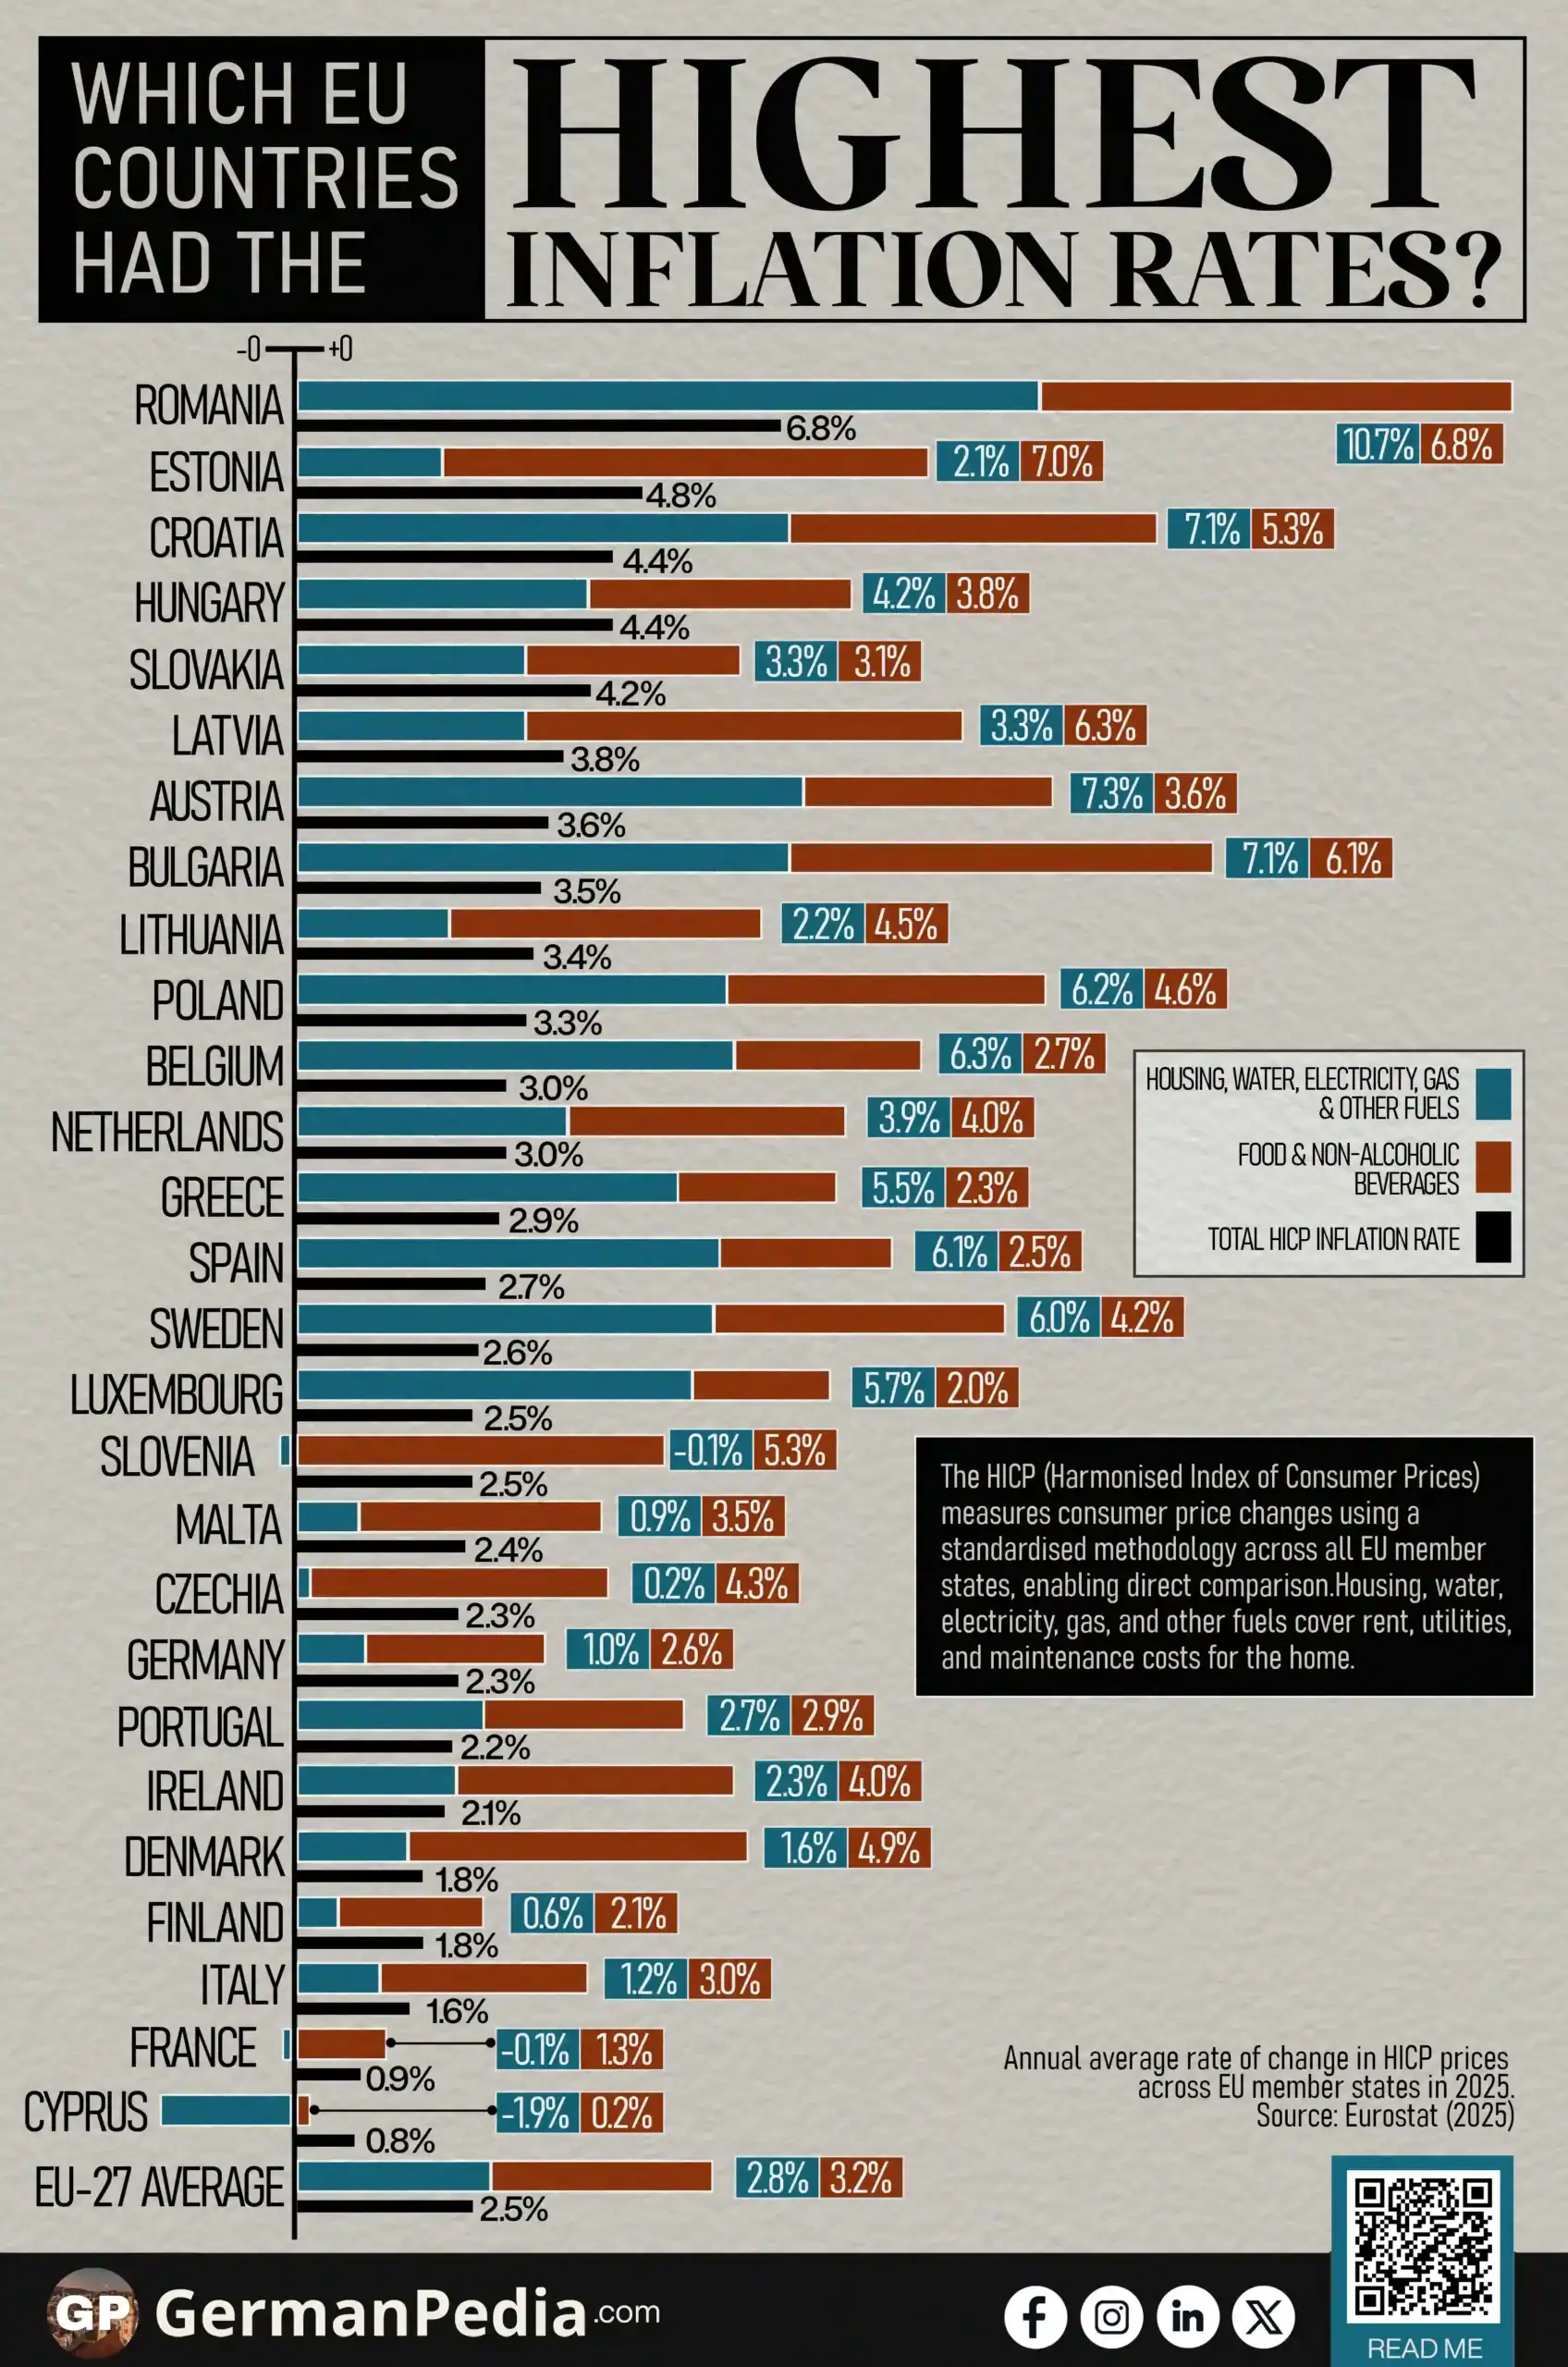
- Romania ranked first in EU inflation in 2025 at 6.8%, more than twice the EU average of 2.5%. Two policy shocks drove this: the removal of electricity price caps in July 2025 led to average bills rising by over 60%, and a VAT increase from 19% to 21% followed in August 2025.
- Food prices rose fastest in Eastern EU countries in 2025. Estonia recorded food inflation of 7.0%, Latvia 6.3%, and Romania 6.8%. All three recorded food inflation well above their national headline rates.
- Housing, water, and energy costs rose sharply in several countries where energy prices were still adjusting in 2025. Austria (7.3%), Bulgaria (7.1%), and Croatia (7.1%) recorded the highest housing inflation outside Romania.
- France (0.9%) and Cyprus (0.8%) recorded the lowest inflation in the EU in 2025. In both countries, falling energy prices pulled housing costs below zero for the year.
- The EU average fell to 2.5% in 2025, down from 9.2% at the 2022 peak. The cooling was sharper in Western EU countries than in Eastern ones.
Use this Visualization: You may use this image for free with proper attribution to GermanPedia (i.e., by linking back to GermanPedia).
Need help communicating complex ideas visually? We help you turn data into your most persuasive story. Contact us to learn more.
Annual HICP Inflation Rate by EU Country
| Country | HICP Inflation Rate | ||
|---|---|---|---|
| Total | Food & Non-Alcoholic Beverages | Housing, Water, Electricity, Gas & Other Fuels | |
| Romania | 6.8% | 6.8% | 10.7% |
| Estonia | 4.8% | 7.0% | 2.1% |
| Croatia | 4.4% | 5.3% | 7.1% |
| Hungary | 4.4% | 3.8% | 4.2% |
| Slovakia | 4.2% | 3.1% | 3.3% |
| Latvia | 3.8% | 6.3% | 3.3% |
| Austria | 3.6% | 3.6% | 7.3% |
| Bulgaria | 3.5% | 6.1% | 7.1% |
| Lithuania | 3.4% | 4.5% | 2.2% |
| Poland | 3.3% | 4.6% | 6.2% |
| Belgium | 3.0% | 2.7% | 6.3% |
| Netherlands | 3.0% | 4.0% | 3.9% |
| Greece | 2.9% | 2.3% | 5.5% |
| Spain | 2.7% | 2.5% | 6.1% |
| Sweden | 2.6% | 4.2% | 6.0% |
| Luxembourg | 2.5% | 2.0% | 5.7% |
| Slovenia | 2.5% | 5.3% | -0.1% |
| Malta | 2.4% | 3.5% | 0.9% |
| Czechia | 2.3% | 4.3% | 0.2% |
| Germany | 2.3% | 2.6% | 1.0% |
| Portugal | 2.2% | 2.9% | 2.7% |
| Ireland | 2.1% | 4.0% | 2.3% |
| Denmark | 1.8% | 4.9% | 1.6% |
| Finland | 1.8% | 2.1% | 0.6% |
| Italy | 1.6% | 3.0% | 1.2% |
| France | 0.9% | 1.3% | -0.1% |
| Cyprus | 0.8% | 0.2% | -1.9% |
| EU-27 Average | 2.5% | 3.2% | 2.8% |
Source: Eurostat (2025)
The HICP (Harmonised Index of Consumer Prices) measures consumer price changes using a standardised methodology across all EU member states, enabling direct comparison.
Housing, water, electricity, gas, and other fuels cover rent, utilities, and maintenance costs for the home.

Romania Stands Far Above Every Other EU Country
The EU average inflation rate in 2025 was 2.5%. Romania recorded 6.8%. No other member state came close.
Romania’s inflation in 2025 reflected two specific policy shocks rather than a broader economic trend. The government removed its electricity price cap on 1 July 2025. Romanian households had paid fixed, subsidised electricity rates for nearly four years. When the cap ended, average electricity bills rose by over 60% compared to the previous month. The government then raised the standard VAT rate from 19% to 21% on 1 August 2025. Both shocks hit within weeks of each other. Together, they pushed Romania’s housing inflation to 10.7% for the year. That figure ranked first in the EU in that category.
Romania’s food inflation also ranked first in the EU at 6.8%. Rising energy costs raised production and transport costs across the food supply chain. Higher VAT on goods is passed through to consumer prices as well.
Food Prices Rose Fastest in Eastern EU Countries
Eastern EU countries recorded the highest food inflation in the EU in 2025. The five countries with the fastest-rising food prices were:
- Estonia: 7.0%
- Latvia: 6.3%
- Bulgaria: 6.1%
- Croatia: 5.3%
- Slovenia: 5.3%
In each case, food inflation ran above the country’s headline rate. Estonia recorded a headline rate of 4.8%. Latvia recorded 3.8%. Bulgaria recorded 3.5%. Eastern EU wages have risen faster than in Western Europe in recent years. Higher purchasing power in economies where food prices remain below the EU average has fed through to faster food price growth.
Central or Eastern European countries accounted for eight of the ten highest food inflation rates in the EU in 2025. The EU average for food inflation was 3.2%, already above the 2.5% headline rate for all items.
Housing Inflation Split the EU in Two Directions in 2025
Housing, water, electricity, and gas costs rose sharply in several countries in 2025. The six highest housing inflation rates outside Romania were:
- Austria: 7.3%
- Bulgaria: 7.1%
- Croatia: 7.1%
- Belgium: 6.3%
- Poland: 6.2%
- Spain: 6.1%
In Austria, Bulgaria, and Croatia, housing inflation ran roughly double the national headline rate. Energy price adjustments still working through domestic markets drove most of this gap.
Three countries recorded negative housing inflation in 2025: Slovenia (−0.1%), France (−0.1%), and Cyprus (−1.9%). Falling energy prices in those markets pulled the housing category below zero. France recorded overall inflation of just 0.9% for the year. Cyprus recorded 0.8%. Both ranked at the bottom of the EU inflation table. In countries where energy prices fell during 2025, lower housing costs offset price rises elsewhere and kept the headline rate well below the EU average.
The East-West Divide in EU Inflation Persisted in 2025
The EU’s inflation gap between East and West narrowed significantly after the 2022 energy crisis, but did not close in 2025. Eastern EU countries continued to record higher inflation rates across food, housing, and total prices.
The EU average fell to 2.5% in 2025, down from 9.2% at the 2022 peak. Price pressures moderated across the bloc. The moderation was not even. Eastern EU economies, where wages are rising faster and price levels remain lower than in Western Europe, continued to see stronger consumer price growth. Romania’s policy-specific shocks added a further layer. The overall pattern in 2025 was a bloc where inflation had cooled, but where the cooling was sharper in the West than in the East.
More topics
- Which EU Cities Have the Most Millionaires?
- Where are Billionaires Concentrated in the EU?
- Top 10 Richest Women in the EU
- Top 10 Biggest EU Companies Led by Women
- Top 13 Most Valuable Brands in the EU
- Income Millionaires In Germany by State
- EU Relies on Imports for Natural Gas
- US Oil Exports to the EU Are Highly Concentrated
- The Best EU Countries to Retire In
- EU Passports Are Among the Strongest in the World
- GDP per Capita vs Actual Consumption per Capita in the EU
- Which Are the Busiest Airports in the EU?
- The Busiest Container Ports in Europe by TEU
- EU Countries With the Most Greenhouse Gas Emissions
- Which EU Countries Have the Most Soft Power?
References
- https://ec.europa.eu/eurostat/databrowser/view/prc_hicp_ainr__custom_21563670/default/table
- https://ec.europa.eu/eurostat/databrowser/view/prc_hicp_ainr__custom_21563691/default/table
- https://ec.europa.eu/eurostat/statistics-explained/index.php?title=Consumer_prices_-_inflation
- https://economy-finance.ec.europa.eu/economic-surveillance-eu-member-states/country-pages/romania/economic-forecast-romania_en
- https://www.ecb.europa.eu/press/blog/date/2025/html/ecb.blog20250925~7fd65a388a.en.html