Key Takeaways
- Between 2015 and 2026, the gap between the EU’s highest and lowest minimum wages in purchasing power terms narrowed from more than 4-to-1 to roughly 2.5-to-1.
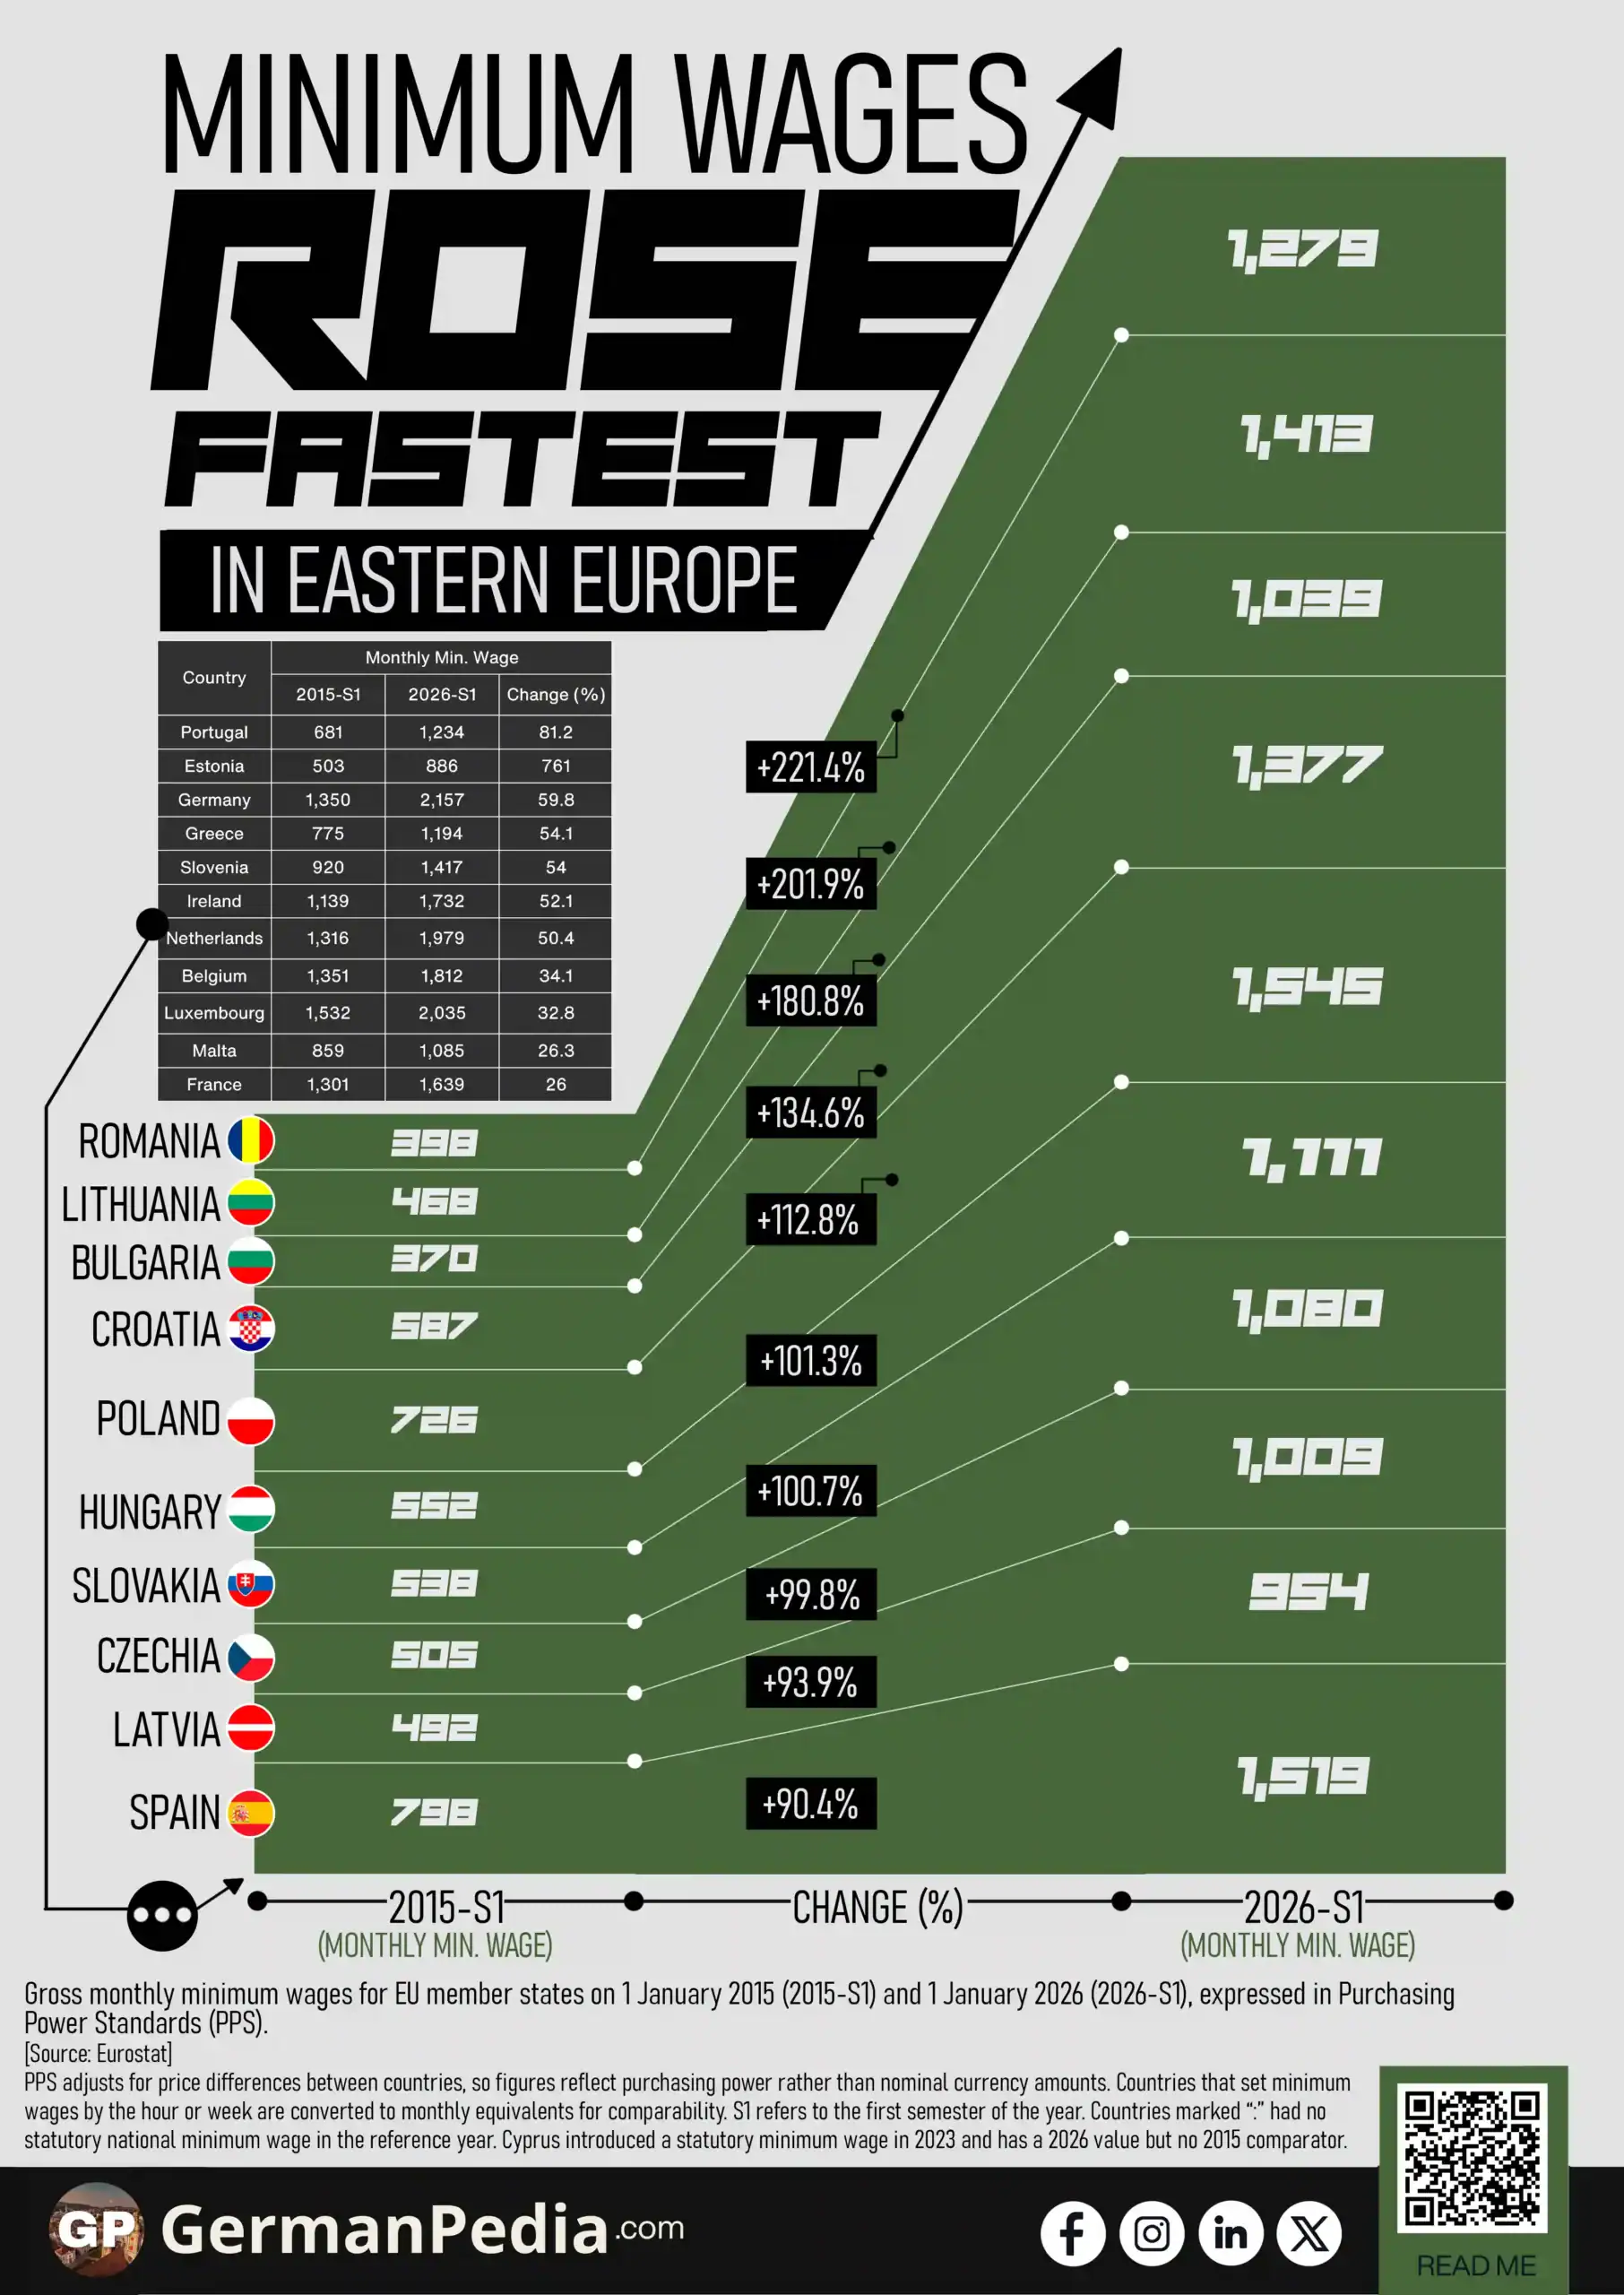
- Romania, Lithuania, and Bulgaria posted the sharpest minimum wage gains in the table, each rising more than 180% between 2015 and 2026.
- The EU’s 2022 Minimum Wage Directive did not set a common wage floor. It required member states to assess adequacy against reference values. The commonly used benchmarks are 60% of the median wage and 50% of the average wage.
- France, Luxembourg, and Belgium each grew under 35% between 2015 and 2026. Their wages were already closer to the directive’s reference values, leaving less room for large increases.
- Spain recorded the sharpest increase among Western EU countries in the table at 90%. The coalition government nearly doubled Spain’s minimum wage between 2019 and 2022.
- Denmark, Italy, Austria, Finland, and Sweden have no statutory national minimum wage. Wage floors in these countries are set primarily through collective bargaining agreements.
Use this Visualization: You may use this image for free with proper attribution to GermanPedia (i.e., by linking back to GermanPedia).
Need help communicating complex ideas visually? We help you turn data into your most persuasive story. Contact us to learn more.
Gross Monthly Minimum Wages in EU Countries
| Country | Monthly Min. Wage | ||
|---|---|---|---|
| 2015-S1 | 2026-S1 | Change (%) | |
| Romania | 398 | 1,279 | +221.4% |
| Lithuania | 468 | 1,413 | +201.9% |
| Bulgaria | 370 | 1,039 | +180.8% |
| Croatia | 587 | 1,377 | +134.6% |
| Poland | 726 | 1,545 | +112.8% |
| Hungary | 552 | 1,111 | +101.3% |
| Slovakia | 538 | 1,080 | +100.7% |
| Czechia | 505 | 1,009 | +99.8% |
| Latvia | 492 | 954 | +93.9% |
| Spain | 798 | 1,519 | +90.4% |
| Portugal | 681 | 1,234 | +81.2% |
| Estonia | 503 | 886 | +76.1% |
| Germany | 1,350 | 2,157 | +59.8% |
| Greece | 775 | 1,194 | +54.1% |
| Slovenia | 920 | 1,417 | +54.0% |
| Ireland | 1,139 | 1,732 | +52.1% |
| Netherlands | 1,316 | 1,979 | +50.4% |
| Belgium | 1,351 | 1,812 | +34.1% |
| Luxembourg | 1,532 | 2,035 | +32.8% |
| Malta | 859 | 1,085 | +26.3% |
| France | 1,301 | 1,639 | +26.0% |
| Denmark | : | : | n/a |
| Italy | : | : | n/a |
| Cyprus | : | 1,173 | n/a |
| Austria | : | : | n/a |
| Finland | : | : | n/a |
| Sweden | : | : | n/a |
Source: Eurostat
PPS adjusts for price differences between countries, so figures reflect purchasing power rather than nominal currency amounts. Countries that set minimum wages by the hour or week are converted to monthly equivalents for comparability.
S1 refers to the first semester of the year. Countries marked “:” had no statutory national minimum wage in the reference year. Cyprus introduced a statutory minimum wage in 2023 and has a 2026 value but no 2015 comparator.

In 2015, the minimum wage in Bulgaria was worth 370 PPS per month. In Luxembourg, it was 1,532 PPS. The difference was more than 4-to-1. By 2026, that gap has narrowed to roughly 2.5 to 1. Among countries with a statutory national minimum wage, the lowest is Estonia at 886 PPS. The highest belongs to Germany at 2,157 PPS.
Central and Eastern Europe drove most of that compression.
Minimum Wages Rose Fastest in Central and Eastern Europe
Minimum wages rose fastest in Central and Eastern Europe. Three countries recorded growth above 180 percent:
- Romania: 398 → 1,279 PPS (+221%)
- Lithuania: 468 → 1,413 PPS (+202%)
- Bulgaria: 370 → 1,039 PPS (+181%)
This growth did not happen gradually. It happened in deliberate, policy-driven steps. The EU’s 2022 Minimum Wage Directive did not set a common wage floor. It required member states with statutory minimum wages to assess adequacy against reference values. The commonly used benchmarks are 60 percent of the median wage and 50 percent of the average wage. For Eastern European countries, statutory floors had historically sat well below those benchmarks. The directive created pressure to close the gap quickly. Bulgaria formalised the approach by law in 2023. The law anchors its national minimum wage at 50 percent of average gross wages. Poland grew 113 percent over the same decade. Croatia grew 135 percent.
Monthly Minimum Wages in Western EU Did Not Move Much
Western European minimum wages rose more slowly over the same period:
- France: +26% between 2015 and 2026
- Luxembourg: +33%
- Belgium: +34%
These countries were already closer to those reference values. The required adjustments were smaller.
Germany is the exception among Western countries. Its minimum wage grew 60 percent between 2015 and 2026 and now leads the EU in PPS terms at 2,157 per month. Germany introduced its statutory minimum wage in January 2015. It started from a lower base than older Western floors. This gave it more room to grow.
Spain and Ireland also diverged from the Western pattern. Spain grew 90 percent over the decade. It recorded the sharpest increase among Western European countries in the table. The jump traces to a political decision made before the directive. The coalition government nearly doubled Spain’s minimum wage between 2019 and 2022. Ireland grew 52 percent between 2015 and 2026. Its minimum wage reached 1,732 PPS by 2026.
Where the Gap in EU Minimum Wages Stands Now
Denmark, Italy, Austria, Finland, and Sweden do not appear in this data because they have no statutory national minimum wage. Wages in these countries are set through sector-level collective bargaining agreements, not by law. The EU directive did not require them to change this approach. Cyprus introduced a statutory minimum wage in 2023 and entered the data for the first time in 2026, with a value of 1,173 PPS.
The direction of travel is clear. Romania and Lithuania have more than tripled their minimum wages since 2015. Bulgaria’s minimum wage rose close to three times its 2015 level. Central and Eastern Europe is converging toward Western wage levels. Estonia’s current floor of 886 PPS is more than twice Bulgaria’s 2015 level of 370 PPS. But the distance from bottom to top remains large. Germany leads at 2,157 PPS. The EU minimum wage map has compressed. It has not flattened.
More topics
- EU Wage Growth In The Last Two Decades
- Germany’s Median Wage by Federal State
- The Best EU Countries to Retire In
- Employment in the EU Is Shifting Toward Higher Education
- Employment by Federal State in Germany
- Which EU Countries Have the Most Soft Power?
- Foreign-Born Population in the EU Is Rising
- EU Old-Age Dependency Ratio by Country
- Government Spending on Education in EU Countries
- EU Relies on Imports for Natural Gas
- US Oil Exports to the EU Are Highly Concentrated
- EU Passports Are Among the Strongest in the World
- EU Rent Price Index by Country Over Time
- Internet Use for Mental Health Information Across the EU
- EU Alternatives to Common US Platforms
References
- https://ec.europa.eu/eurostat/databrowser/view/earn_mw_cur__custom_21494224/default/table
- https://employment-social-affairs.ec.europa.eu/policies-and-activities/rights-work/labour-law/working-conditions/adequate-minimum-wages-eu_en
- https://www.eurofound.europa.eu/en/publications/all/real-growth-in-minimum-wages-in-2026-amid-both-progress-and-pullback-on-member-states-ambitions
- https://www.socialeurope.eu/closing-the-chasm-central-and-eastern-europes-continued-minimum-wage-climb
- https://www.sozialministerium.gv.at/en/Topics/Labour/Labour-Law/Remuneration/Minimum-Wage-Directive.html