Key Takeaways
- Net household saving rates diverged across the EU over time. Between 2004 and 2024, countries followed different paths, shaped by income growth, financial systems, and economic shocks.
- The pandemic was a major turning point. In 2020, saving rates surged across many countries, reaching 22.2% in Ireland, 20.8% in Luxembourg, and 16.0% in Germany.
- Estonia shows the clearest structural shift. From −11.2% in 2004 to 3.0% in 2024, savings moved from credit-driven consumption to more cautious, income-based behaviour.
- Some countries faced declining saving rates, including Greece (−12.9 pp), Italy (−6.9 pp), and Belgium (−3.9 pp). This reflects weaker income growth and higher spending.
Use this Visualization: You may use this image for free with proper attribution to GermanPedia (i.e., by linking back to GermanPedia).
Need help communicating complex ideas visually? We help you turn data into your most persuasive story. Contact us to learn more.
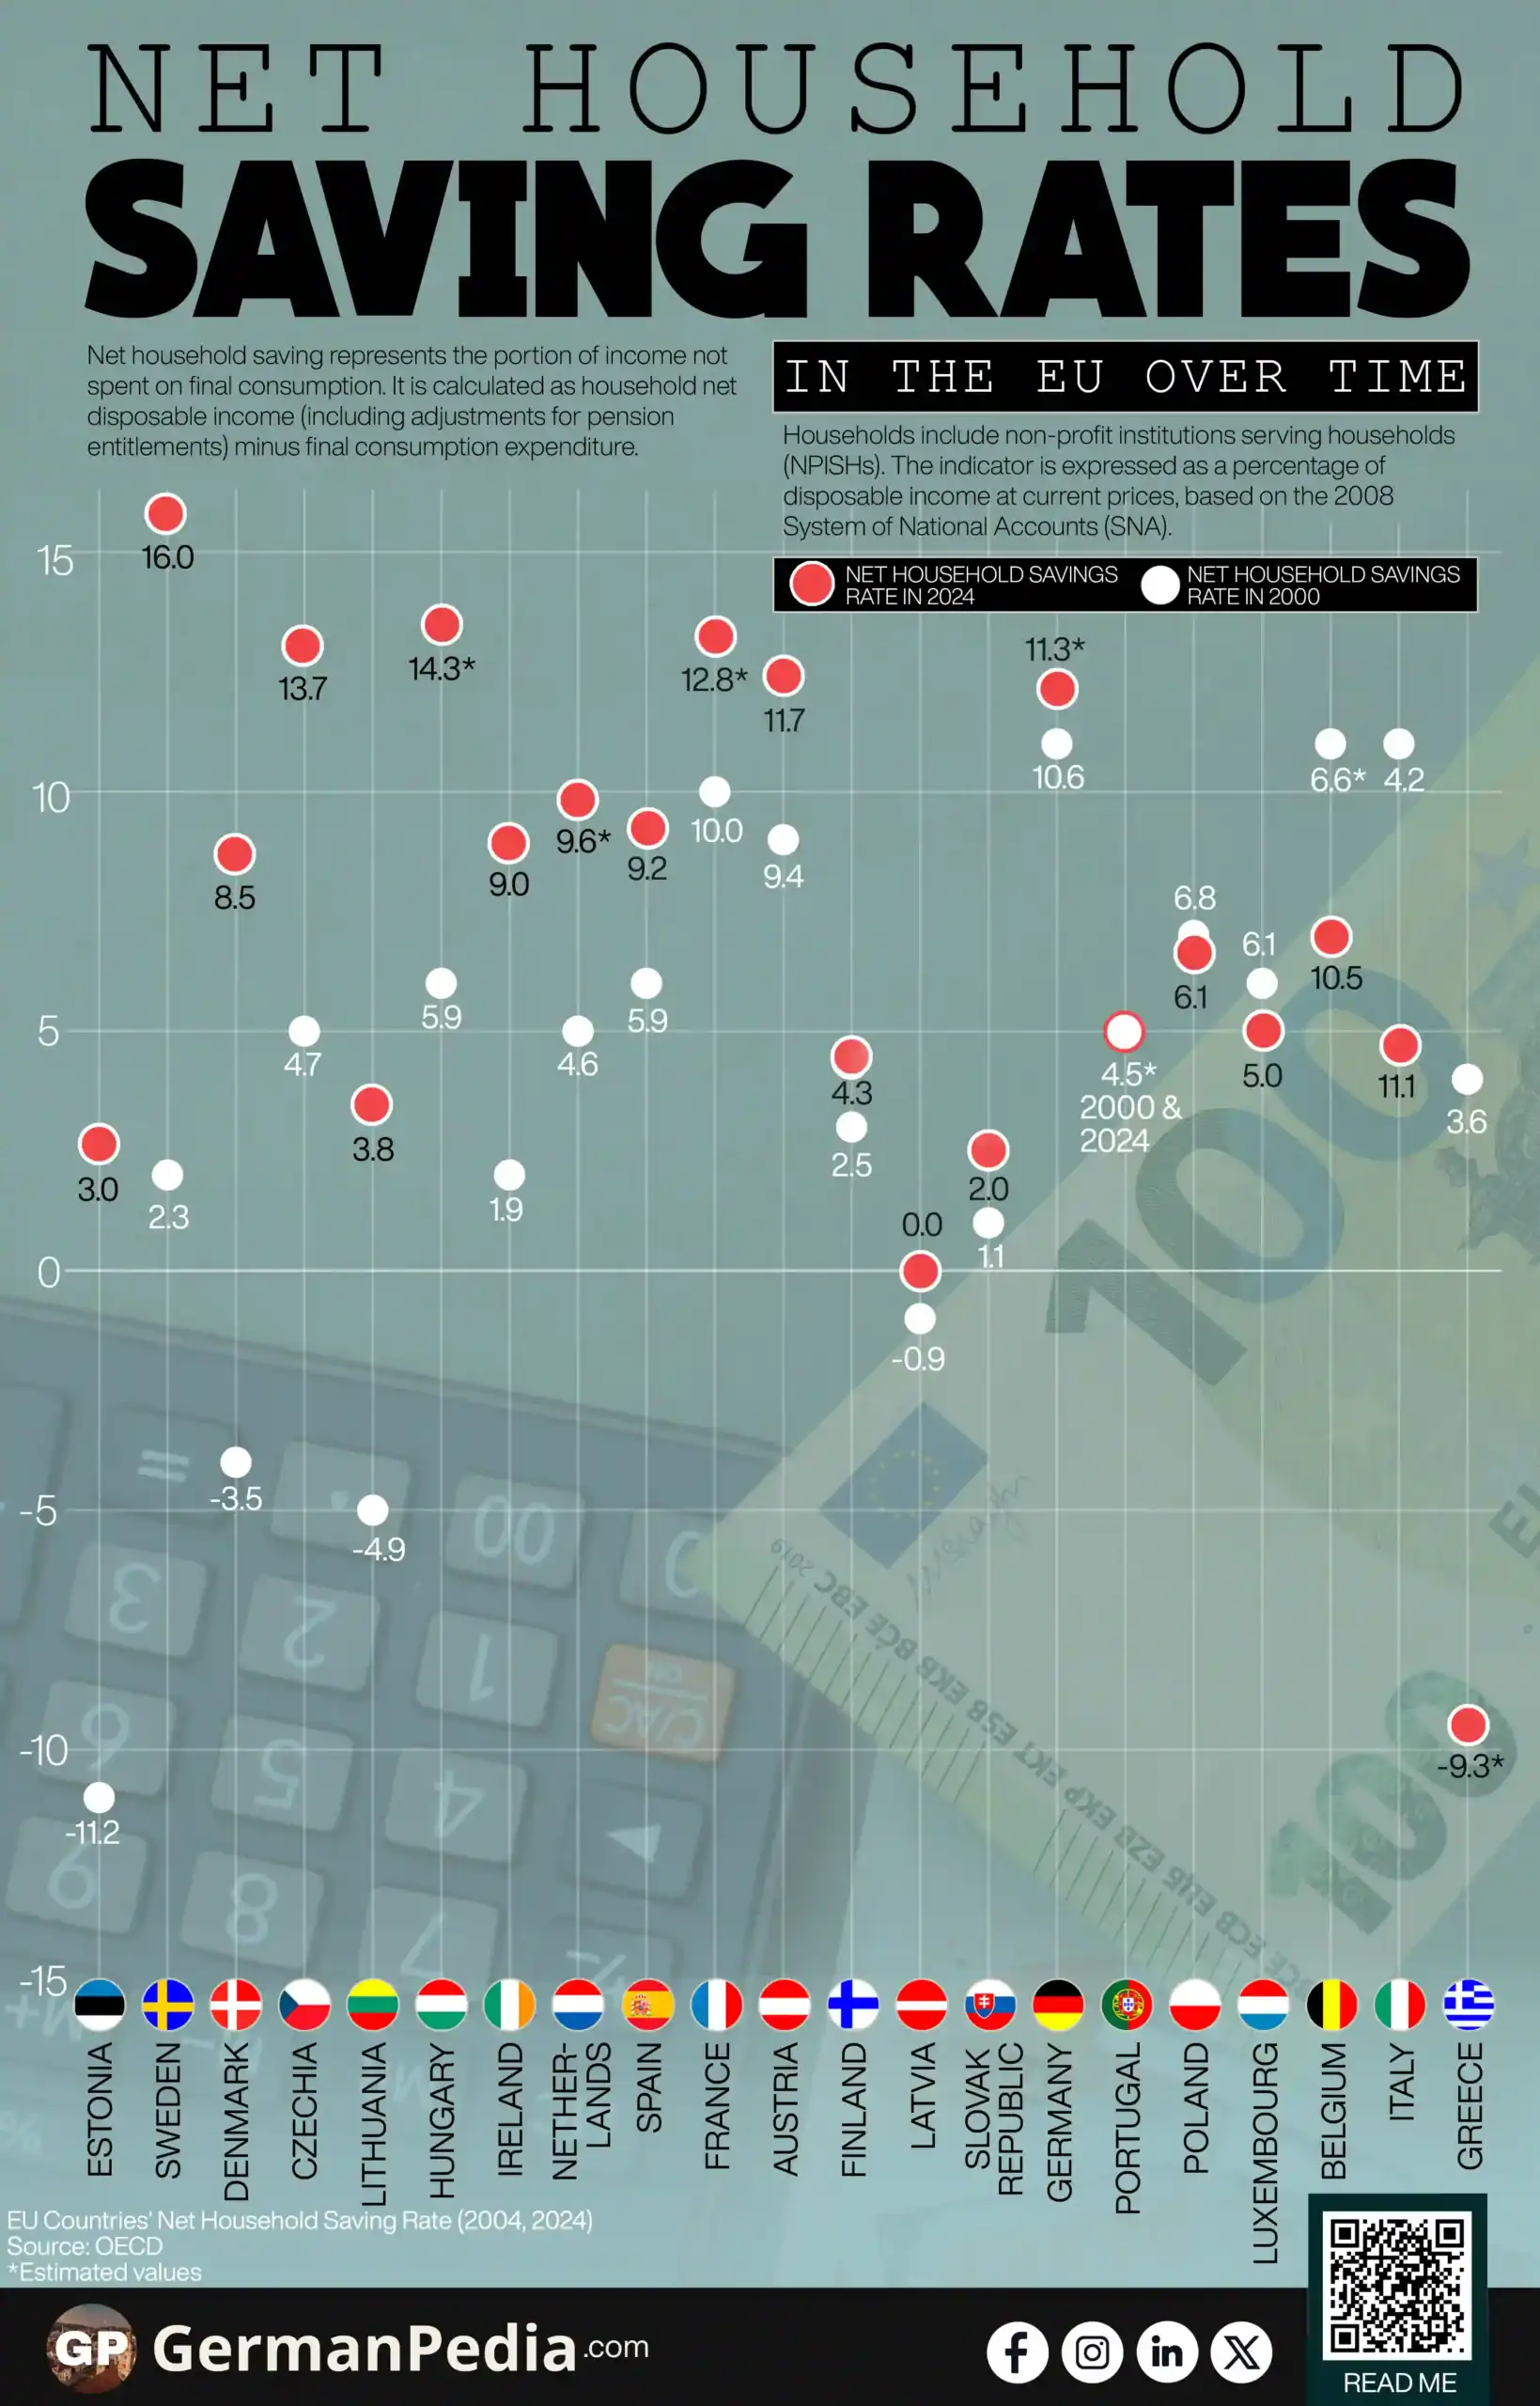
Net Household Saving Rate in EU Countries
| Country | Net Household Savings Rate | |||
|---|---|---|---|---|
| 2004 | 2020 | 2024 | Change in pp (2004-2024) | |
| Estonia | -11.2 | 9.2 | 3.0 | +14.3 |
| Sweden | 2.3 | 15.0 | 16.0 | +13.7 |
| Denmark | -3.5 | 3.0 | 8.5 | +11.9 |
| Czechia | 4.7 | 12.5 | 13.7 | +9.0 |
| Lithuania | -4.9 | 8.3 | 3.8 | +8.8 |
| Hungary | 5.9 | 12.0 | 14.3* | +8.4 |
| Ireland | 1.9 | 22.2 | 9.0 | +7.1 |
| Netherlands | 4.6 | 15.6 | 9.6* | +4.9 |
| Spain | 5.9 | 14.3 | 9.2 | +3.3 |
| France | 10.0 | 14.8 | 12.8* | +2.8 |
| Austria | 9.4 | 13.6 | 11.7 | +2.2 |
| Finland | 2.5 | 6.8 | 4.3 | +1.8 |
| Latvia | -0.9 | 9.7 | 0.0 | +1.0 |
| Slovak Republic | 1.1 | 5.4 | 2.0 | +0.8 |
| Germany | 10.6 | 16.0 | 11.3* | +0.7 |
| Portugal | 4.5 | 3.7 | 4.5* | −0.0 |
| Poland | 6.8 | 11.1 | 6.1 | −0.7 |
| Luxembourg | 6.1 | 20.8 | 5.0 | −1.1 |
| Belgium | 10.5 | 13.0 | 6.6* | −3.9 |
| Italy | 11.1 | 10.3 | 4.2 | −6.9 |
| Greece | 3.6 | -6.9 | -9.3* | −12.9 |
Source: OECD
*Estimated values
Net household saving represents the portion of income not spent on final consumption. It is calculated as household net disposable income (including adjustments for pension entitlements) minus final consumption expenditure. Households include non-profit institutions serving households (NPISHs). The indicator is expressed as a percentage of disposable income at current prices, based on the 2008 System of National Accounts (SNA).

Net household saving is the portion of income that households do not spend after taxes and consumption. In simple terms, it shows how much of their income people keep.
Between 2004 and 2024, saving behaviour across EU countries evolved in divergent directions. The pandemic, in particular, stands out as a period when household saving rates rose sharply across much of the world.
The largest increases are found in countries that started from low or even negative saving rates:
- Estonia: −11.2% → 3.0% (+14.3 pp)
- Sweden: 2.3% → 16.0% (+13.7 pp)
- Denmark: −3.5% → 8.5% (+11.9 pp)
- Czechia: 4.7% → 13.7% (+9.0 pp)
Estonia is the clearest example of this shift. Around 2004, savings were very low as consumption grew quickly, supported by credit and a housing boom. Households were spending more than their income.
Over time, this reversed. After the global financial crisis, households became more cautious, incomes grew, and borrowing slowed, leading to a gradual rise in the saving rate.
Denmark’s low starting point shows a different system. Danish households typically carry high mortgage debt, but the country’s strong welfare system reduces the need for precautionary saving for risks such as unemployment or health shocks. This combination can result in low or even negative saving rates, even when overall household wealth remains high.
In contrast, Sweden and Czechia show a steadier pattern. Saving was already positive and increased further, supported by strong labour markets, rising incomes, and sound public finances. In these countries, households were able to save a larger share of their disposable income as economic conditions improved.
Top 10 Foreign Holders of German Government Debt ->
Meanwhile, some countries moved in the opposite direction:
- Greece: 3.6% → −9.3% (−12.9 pp)
- Italy: 11.1% → 4.2% (−6.9 pp)
- Belgium: 10.5% → 6.6% (−3.9 pp)
This reflects households that are often spending more than their income, for different reasons, such as:
- In Greece, the country’s gross disposable income is below 20% of the EU average, leaving less room to build savings.
- In Italy, repeated fiscal tightening, weak wage growth, ageing, and rising inequality have gradually squeezed household budgets.
How did the pandemic affect the EU net household savings rate?
Across many countries, saving rates increased sharply during the COVID-19 pandemic:
- Ireland reached 22.2%
- Luxembourg rose to 20.8%
- Germany climbed to 16.0%
Many households faced a combination of different factors:
- Spending opportunities were limited due to lockdowns and restrictions.
- Government measures helped support incomes, reducing the need to cut consumption sharply.
- Heightened uncertainty encouraged precautionary saving.
These pandemic‑related shocks changed inflation patterns.
In 2020, weak demand kept prices low, but later, rising demand, supply bottlenecks, and excess savings built up during the crisis helped push inflation higher in the EU.
After 2020, interest rates rose sharply as central banks tightened policy to bring inflation back under control. This made borrowing more expensive and increased the return on savings compared with the low‑rate years of the 2010s.
Many households also stayed more cautious after the pandemic. Even once restrictions ended, spending did not fully return to pre‑pandemic levels. Some households, especially higher‑income groups, saved a large financial buffer and continued to sustain it.
Together, these factors helped keep net household saving rates elevated in most of the EU even after the initial shock had passed.
More topics
- GDP per Capita vs Actual Consumption per Capita in the EU
- Where are Billionaires Concentrated in the EU?
- Happiness vs Income in the EU
- Which Countries Use AI the Most in the EU?
- Electric and Hybrid Cars in the EU: Who Is Leading the Shift?
- Claude Usage in the EU: Which Countries Lead and Why?
- Petrol Prices Are Rising Across the EU
- Top 13 Most Valuable Brands in the EU
- Foreign-Born Population in the EU Is Rising
- EU Countries with the Most U.S. Troops
- Where are Billionaires Concentrated in the EU?
- Employment by Federal State in Germany
- Germany’s Median Wage by Federal State
- Top EU Countries Where People Say They Don’t Need AI
- EU Unicorn Startups: Which Countries Lead and Why
- EU Alternatives to Common US Platforms
- Most Surveilled Major Cities in the EU
References
- https://data-explorer.oecd.org/vis?fs[0]=Topic%2C1%7CEconomy%23ECO%23%7CNational%20accounts%23ECO_NAD%23&fs[1]=Topic%2C3%7CEconomy%23ECO%23%7CNational%20accounts%23ECO_NAD%23%7CGDP%20and%20non-financial%20accounts%23ECO_NAD_GNF%23%7CNational%20Accounts%20at%20a%20Glance%23ECO_NAD_GNF_NAT%23&pg=0&fc=Topic&snb=12&df[ds]=dsDisseminateFinalDMZ&df[id]=DSD_NAAG%40DF_NAAG_V&df[ag]=OECD.SDD.NAD&dq=A.AUT%2BCZE%2BDNK%2BEST%2BFIN%2BFRA%2BDEU%2BGRC%2BHUN%2BIRL%2BITA%2BLVA%2BLTU%2BLUX%2BNLD%2BPOL%2BPRT%2BSVK%2BESP%2BSWE%2BBEL.B8NS1M..&pd=2004%2C2024&to[TIME_PERIOD]=false&vw=tb
- https://www.elibrary.imf.org/view/journals/001/2023/150/article-A001-en.xml
- https://ec.europa.eu/eurostat/statistics-explained/SEPDF/cache/65805.pdf
- https://haldus.eestipank.ee/sites/default/files/publication/en/Archive/kroon_economy/2007/_5.pdf
https://dipartimenti.unicatt.it/politica-economica-ISPE0063.pdf - https://www.nationalbanken.dk/media/xmzow4j0/em-inequality-and-savings-memo.pdf
- https://www.ecb.europa.eu/press/economic-bulletin/focus/2022/html/ecb.ebbox202205_03~d262f01c8b.en.html
- https://www.kbc.com/en/economics/publications/belgians-are-saving-less-and-less-and-that-has-implications%20%20%20.html