Key Takeaways
- Household expenditure on food and non-alcoholic beverages declined in most EU countries between 2000 and 2024.
- The largest decreases are concentrated in Central and Eastern Europe, including Bulgaria, Latvia, Poland, and Croatia.
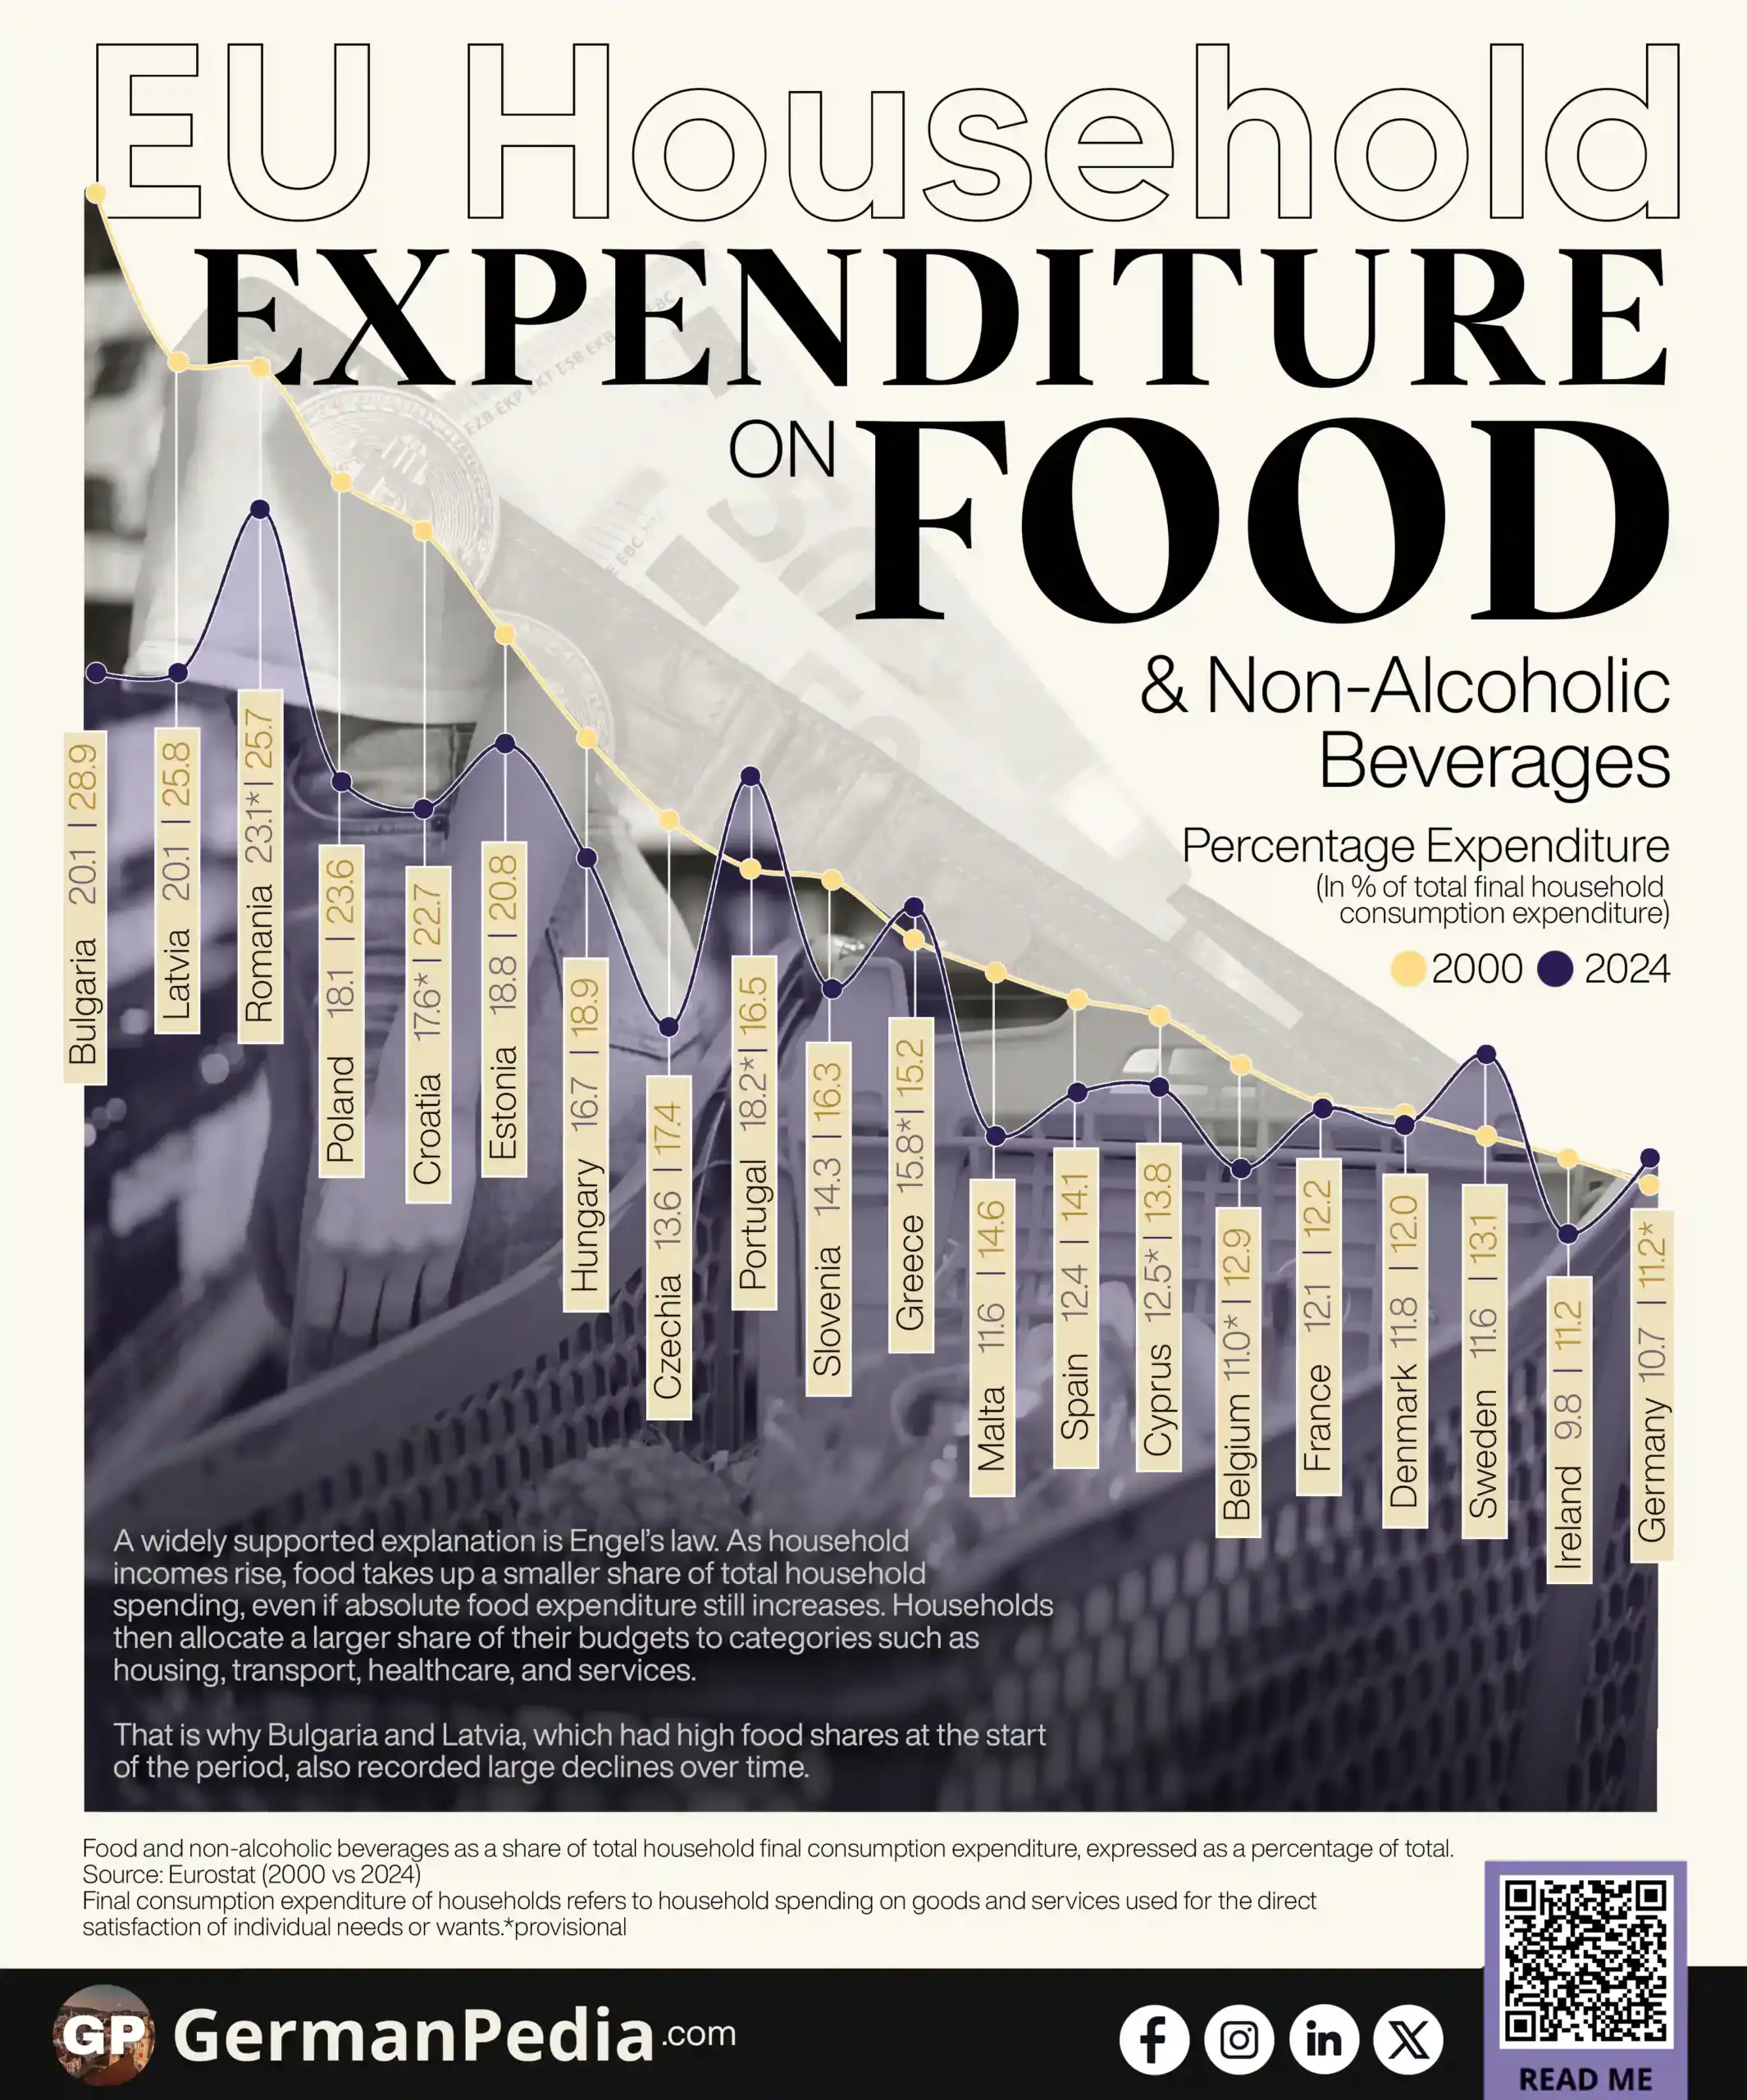
- A widely supported explanation is Engel’s law. As incomes rise, food takes up a smaller share of the household budget, even if actual food spending still increases.
Use this Visualization: You may use this image for free with proper attribution to GermanPedia (i.e., by linking back to GermanPedia).
Need help communicating complex ideas visually? We help you turn data into your most persuasive story. Contact us to learn more.
Household Expenditure on Food and Non-Alcoholic Beverages in the EU
| Country | Expenditure (In % of total final household consumption expenditure) | Change (In p.p.) | |
|---|---|---|---|
| 2000 | 2024 | ||
| Bulgaria | 28.9 | 20.1 | -8.8 |
| Latvia | 25.8 | 20.1 | -5.7 |
| Romania | 25.7 | 23.1* | -2.6 |
| Poland | 23.6 | 18.1 | -5.5 |
| Croatia | 22.7 | 17.6* | -5.1 |
| Estonia | 20.8 | 18.8 | -2.0 |
| Slovakia | 19.4 | 19.7 | +0.3 |
| Hungary | 18.9 | 16.7 | -2.2 |
| Czechia | 17.4 | 13.6 | -3.8 |
| Portugal | 16.5 | 18.2* | +1.7 |
| Slovenia | 16.3 | 14.3 | -2.0 |
| Greece | 15.2 | 15.8* | +0.6 |
| Italy | 14.8 | 14.7 | -0.1 |
| Malta | 14.6 | 11.6 | -3.0 |
| Spain | 14.1 | 12.4 | -1.7 |
| Cyprus | 13.8 | 12.5* | -1.3 |
| Belgium | 12.9 | 11.0* | -1.9 |
| Finland | 12.6 | 12.7 | +0.1 |
| France | 12.2 | 12.1 | -0.1 |
| Denmark | 12.0 | 11.8 | -0.2 |
| Sweden | 11.6 | 13.1 | +1.5 |
| Ireland | 11.2 | 9.8 | -1.4 |
| Germany | 10.7 | 11.2* | +0.5 |
| Austria | 10.6 | 10.2 | -0.4 |
| Netherlands | 10.5 | 11.3* | +0.8 |
| Luxembourg | 8.6 | 9.3 | +0.7 |
| Lithuania | — | 18.6 | — |
Source: Eurostat (2000 vs 2024)
Final consumption expenditure of households refers to household spending on goods and services used for the direct satisfaction of individual needs or wants.
*provisional

Household expenditure on food and non-alcoholic beverages varies widely across EU countries. Several factors contribute to these differences, including income levels, relative prices, and consumption patterns.
Generally, lower-income countries spend a larger share of their household budgets on food and non-alcoholic beverages. Meanwhile, higher-income countries such as Luxembourg allocate a smaller share to these items.
Between 2000 and 2024, the share of total household expenditure allocated to this category also declined in most EU countries.
The largest decreases are concentrated in Central and Eastern Europe:
- Bulgaria — -8.8 pp
- Latvia — -5.7 pp
- Poland — -5.5 pp
- Croatia — -5.1 pp
These countries started with a high share of expenditure on food and non-alcoholic beverages in 2000 and remained among the higher-share countries in 2024.
A widely supported explanation is Engel’s law. As household incomes rise, food takes up a smaller share of total household spending, even if absolute food expenditure still increases. Households then allocate a larger share of their budgets to categories such as housing, transport, healthcare, and services.
That is why Bulgaria and Latvia, which had high food shares at the start of the period, also recorded large declines over time.
Overall, household expenditure on food and non-alcoholic beverages is declining in most EU countries, but differences between countries remain significant.
More topics
- Net Household Saving Rates in the EU Over Time
- GDP per Capita vs Actual Consumption per Capita in the EU
- EU Wage Growth In The Last Two Decades
- Grocery Prices in Germany
- 49% of Young Adults Live With Their Parents in the EU
- Homeownership Rate in the EU
- Germany’s Home Prices Rise 13.8% as Growth Shifts Regions
- Apartment Rents Are Rising Faster Than House Rents in Germany
- EU Countries Are Only Partly Self-Sufficient in Food
- Public School Primary Teacher Salaries in the EU
- Internet Freedom in the EU Is High but Shaped by National Rules
- Adoption of Electric and Hybrid Passenger Cars in the EU
- Where are Data Centers Concentrated in the EU?
- Most Surveilled Major Cities in the EU
- Homeownership Rate in the EU
References
- https://ec.europa.eu/eurostat/databrowser/view/nama_10_cp18__custom_21216522/default/table
- https://ec.europa.eu/eurostat/statistics-explained/index.php?title=Household_consumption_by_purpose
- https://ec.europa.eu/eurostat/statistics-explained/index.php?title=Household_budget_survey_-_statistics_on_consumption_expenditure
- https://ec.europa.eu/eurostat/statistics-explained/index.php?title=Regional_household_income_statistics
- https://ec.europa.eu/eurostat/web/products-eurostat-news/w/ddn-20230201-1
- https://ec.europa.eu/eurostat/web/products-eurostat-news/w/ddn-20230327-2
- https://ec.europa.eu/eurostat/statistics-explained/SEPDF/cache/50524.pdf
- https://ec.europa.eu/eurostat/statistics-explained/index.php?title=GDP_per_capita%2C_consumption_per_capita_and_price_level_indices
- https://www.ecb.europa.eu/press/blog/date/2025/html/ecb.blog20250925~7fd65a388a.en.html
- https://www.gesis.org/fileadmin/upload/dienstleistung/daten/amtl_mikrodaten/europ_microdata/Abstracts_2021/057_Menyhert_Balint.pdf
- https://www.euronews.com/business/2025/12/15/food-prices-in-europe-which-countries-are-the-most-and-least-expensive