Key takeaways
- The EU average old-age dependency ratio stands at 34.5%. The main driver is the aging of Europe’s baby boom generation, born between the late 1940s and mid-1960s. Birth rates across the EU have remained well below the level needed to replace the population.
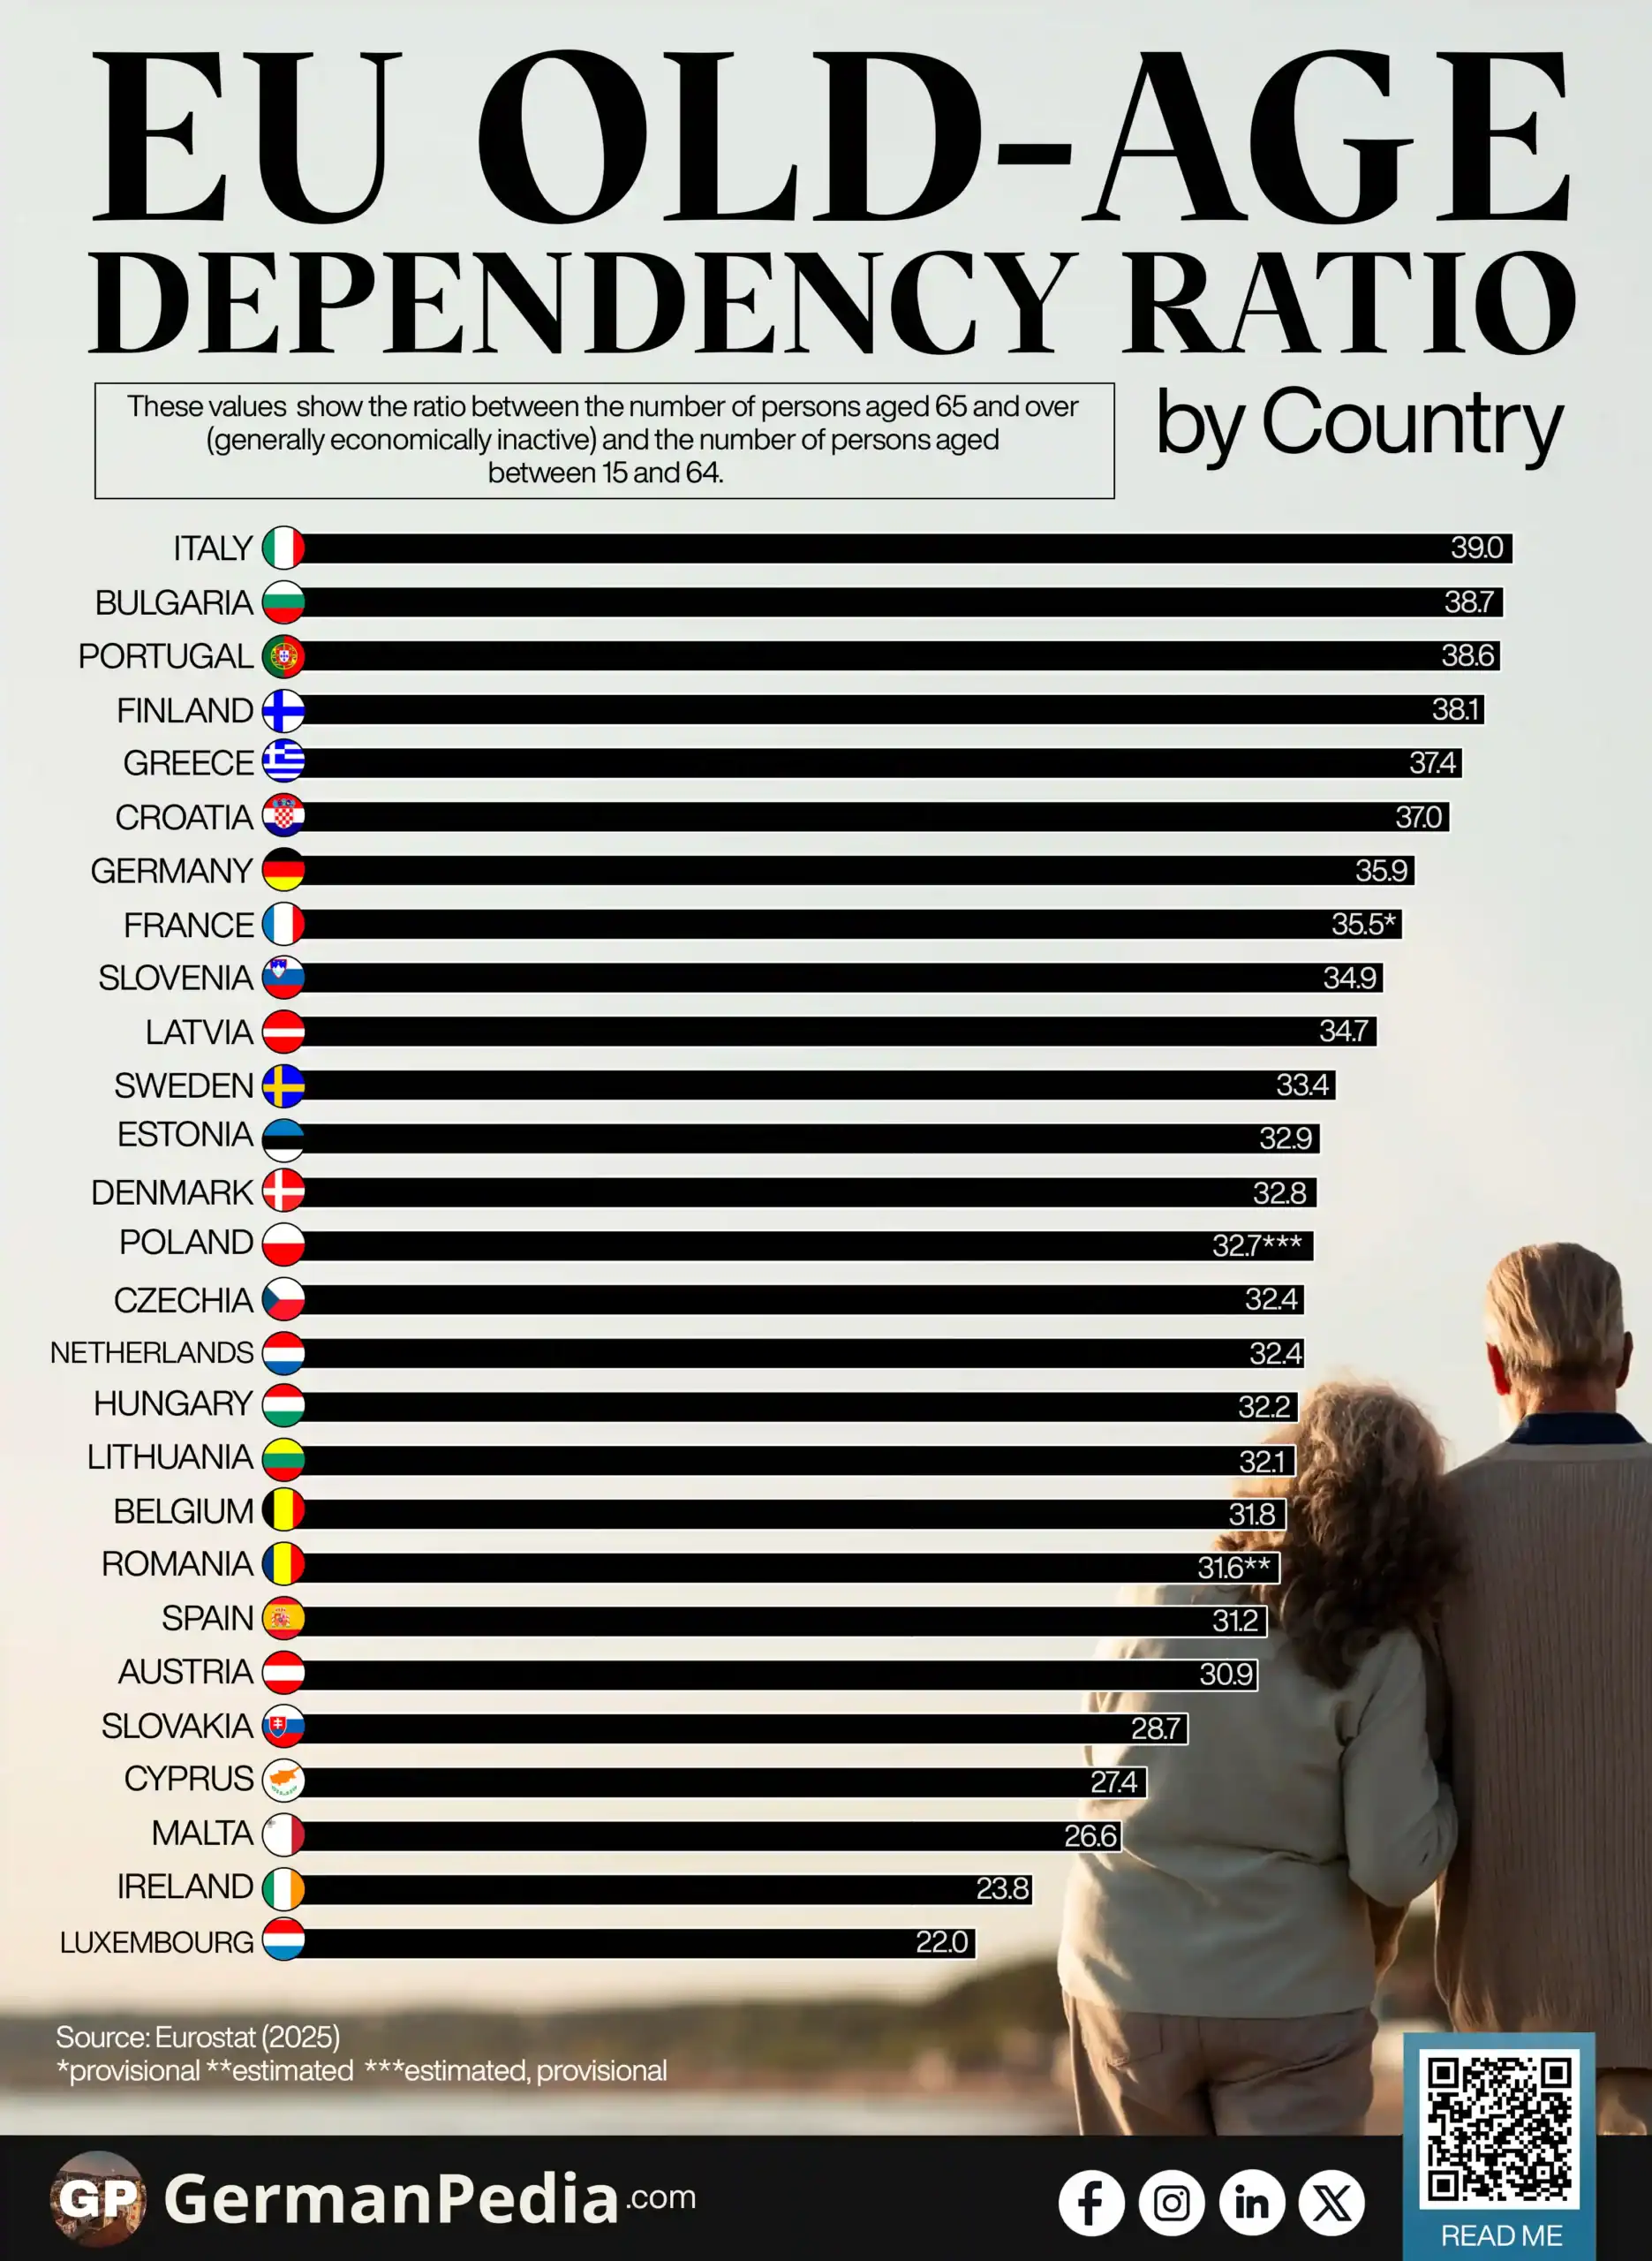
- Italy has the highest old-age dependency ratio in the EU at 39.0%. Luxembourg records the lowest at 22.0%.
- Italy and Portugal’s high ratios are driven by high life expectancy and low fertility. Italy’s life expectancy of 83.8 years is the second highest in the EU.
- Bulgaria ranks second at 38.7% despite having the EU’s lowest life expectancy and highest fertility rate. Its high ratio is driven by emigration. Most of those who left were Bulgarian nationals.
- Luxembourg and Ireland rank lowest because of sustained inflows of working-age migrants. Immigrants across the EU tend to be significantly younger than the existing population. This keeps the working-age group large.
Use this Visualization: You may use this image for free with proper attribution to GermanPedia (i.e., by linking back to GermanPedia).
Need help communicating complex ideas visually? We help you turn data into your most persuasive story. Contact us to learn more.
Old-age-dependency ratio in the EU
| Country | Old-age-dependency ratio (Number of persons aged 65 and over / Number of persons aged between 15 and 64) |
|---|---|
| Italy | 39.0 |
| Bulgaria | 38.7 |
| Portugal | 38.6 |
| Finland | 38.1 |
| Greece | 37.4 |
| Croatia | 37.0 |
| Germany | 35.9 |
| France | 35.5* |
| Slovenia | 34.9 |
| Latvia | 34.7 |
| Sweden | 33.4 |
| Estonia | 32.9 |
| Denmark | 32.8 |
| Poland | 32.7*** |
| Czechia | 32.4 |
| Netherlands | 32.4 |
| Hungary | 32.2 |
| Lithuania | 32.1 |
| Belgium | 31.8 |
| Romania | 31.6** |
| Spain | 31.2 |
| Austria | 30.9 |
| Slovakia | 28.7 |
| Cyprus | 27.4 |
| Malta | 26.6 |
| Ireland | 23.8 |
| Luxembourg | 22.0 |
Source: Eurostat (2025)
*provisional **estimated ***estimated, provisional

Most EU pension systems are pay-as-you-go. Current workers’ contributions fund current retirees’ pensions. When the old-age dependency ratio rises, fewer workers support more retirees.
In 2025, the EU average old-age dependency ratio stands at 34.5%. The main driver is the aging of Europe’s baby boom generation. This generation, born between the late 1940s and mid-1960s, has been entering retirement across the EU. Birth rates across the EU have remained well below the level needed to replace the population.
Which EU countries have the highest old-age dependency ratios?
Italy (39.0%), Bulgaria (38.7%), and Portugal (38.6%) have the highest old-age dependency ratios in the EU. All three Eastern European countries sit more than 4 percentage points above the EU average of 34.5%.
Italy and Portugal share the same profile. Life expectancy is high. Fertility is low. Italy’s life expectancy stands at 83.8 years, the second highest in the EU.
Bulgaria follows a different route. It has lower life expectancy and higher fertility compared to Italy and Portugal. Yet Bulgaria ranks second in the EU.
The old-age dependency ratio rises when the working-age population shrinks, even without the elderly share growing. Bulgaria’s population fell by 1.3 million people between 2004 and 2024. In 2023, most of Bulgaria’s emigrants were Bulgarian nationals. Bulgaria’s dependency ratio reflects who leaves, not just who ages.
Foreign-Born Population in the EU Is Rising ->
Which EU countries have the lowest old-age dependency ratios?
Luxembourg (22.0%) and Ireland (23.8%) have the lowest old-age dependency ratios in the EU.
Luxembourg and Ireland both have large, sustained inflows of working-age people. Immigrants across the EU tend to be significantly younger than the existing population. This expands the working-age group and keeps the ratio low.
The two countries show it differently. Luxembourg draws the large majority of its immigrants from other EU countries. Ireland has the youngest population structure in the EU. It has the lowest median age and the highest share of children among all 27 member states.
Across the EU, a country’s old-age dependency ratio is not only a demographic figure. It reflects decades of decisions about who stays, who leaves, and who arrives.
More topics
- Europe’s Population Shifted Over 20 Years
- Life Expectancy in EU Countries
- The Best EU Countries to Retire In
- Foreign-Born Population in the EU Is Rising
- Top Relocation Destinations for Germans
- EU Passports Are Among the Strongest in the World
- German Population Growth Between 1997 and 2025
- EU Rent Price Index by Country Over Time
- Internet Use for Mental Health Information Across the EU
- How Do Germans Perceive Other Countries as Allies and Threats?
- Which EU Countries Have the Highest Diabetes Prevalence?
- Most Visited AI Websites in Germany
- EU Alternatives to Common US Platforms
- Where are Data Centers Concentrated in the EU?
- Which EU Countries Have the Most Soft Power?
- Which EU Countries Have the Highest Obesity Rates?