Key Takeaways
- Women make up 35.2% of managers in the EU in 2024. It went up from 29.7% in 2002. The 5.5 percentage-point increase shows steady but gradual progress.
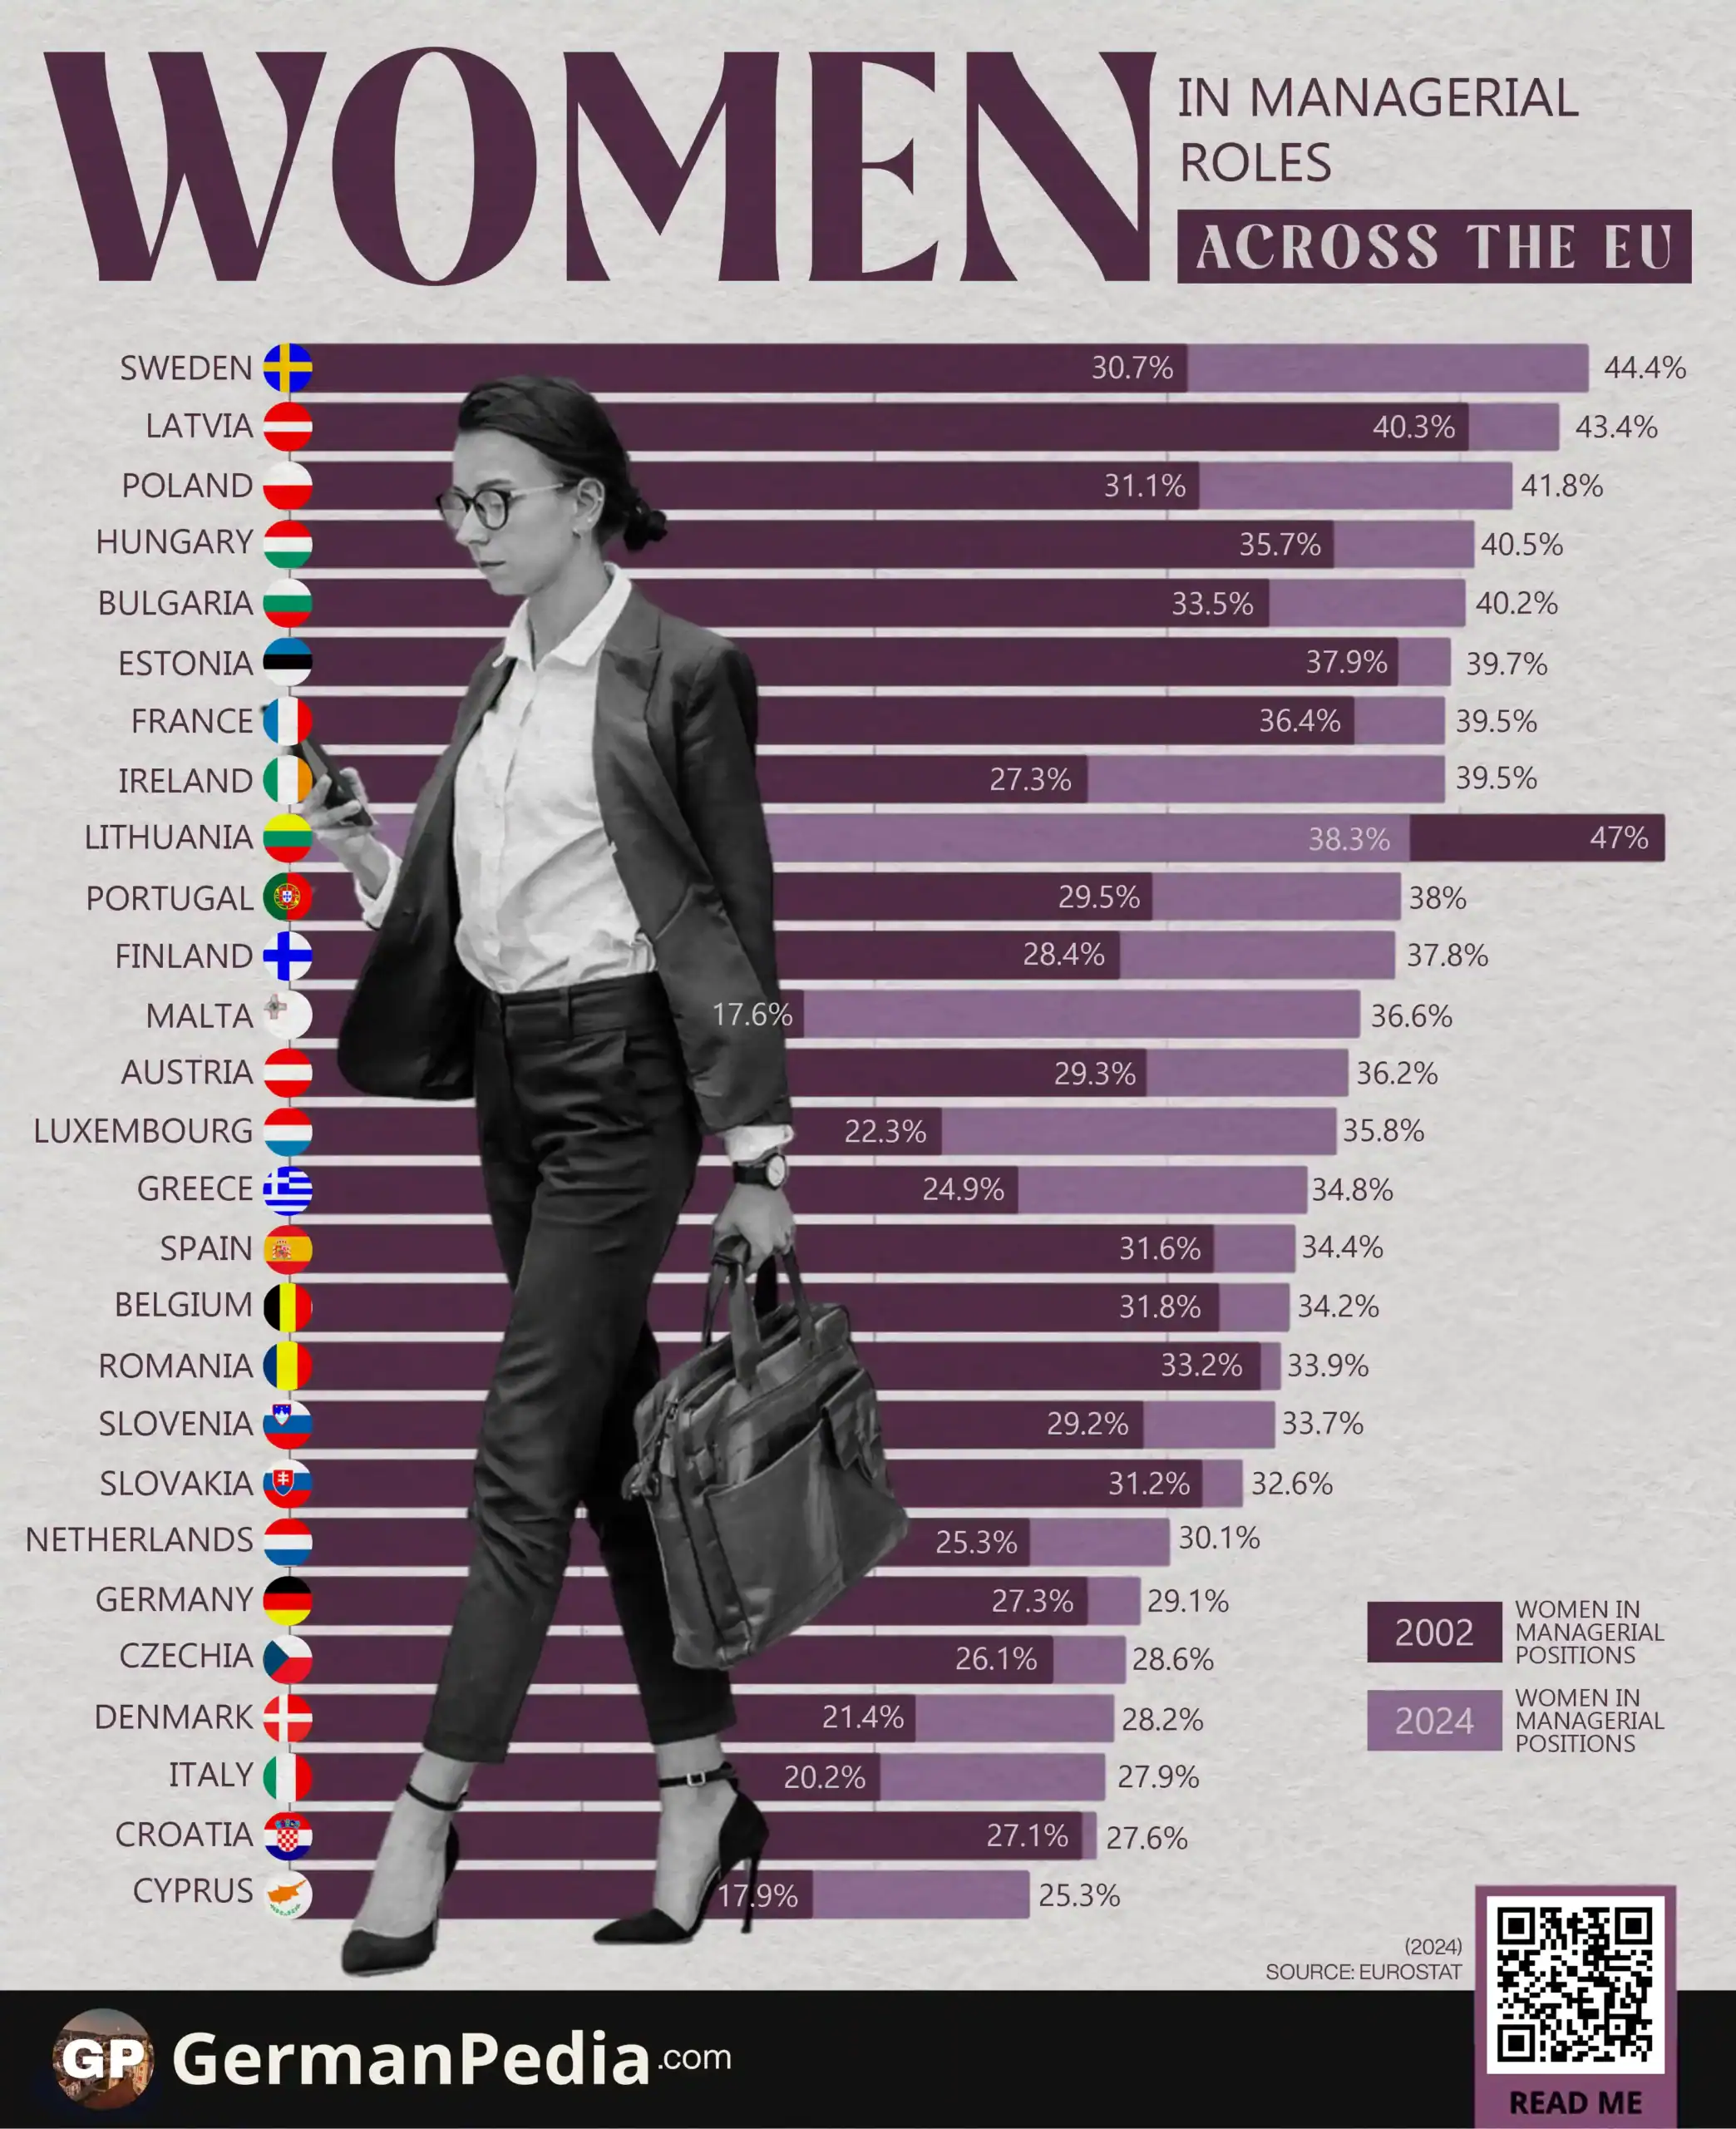
- Sweden (44.4%) and Latvia (43.4%) have the highest female representation in managerial roles. This is supported by high female labour participation and strong public-sector employment.
- At the lower end, Cyprus (25.3%), Croatia (27.6%), and Italy (27.9%) remain below 30%. Germany (29.1%) is also under this threshold.
- The biggest increases since 2002 occurred in Malta (+19 p.p.), Sweden (+13.7), and Luxembourg (+13.5).
- The gradual growth reflects steady female workforce participation, growth in service sectors, and generational turnover as more educated women move into management.
Use this Visualization: You may use this image for free with proper attribution to GermanPedia (i.e., by linking back to GermanPedia).
Need help communicating complex ideas visually? We help you turn data into your most persuasive story. Contact us to learn more.
Female Share of Managers in the EU
| Rank | Country | Women in managerial positions (% out of Total) | Change in p.p. | |
|---|---|---|---|---|
| 2002 | 2024 | |||
| 1 | Sweden | 30.7% | 44.4% | +13.7 |
| 2 | Latvia | 40.3% | 43.4% | +3.1 |
| 3 | Poland | 31.1% | 41.8% | +10.7 |
| 4 | Hungary | 35.7% | 40.5% | +4.8 |
| 5 | Bulgaria | 33.5% | 40.2% | +6.7 |
| 6 | Estonia | 37.9% | 39.7% | +1.8 |
| 7 | France | 36.4% | 39.5% | +3.1 |
| 8 | Ireland | 27.3% | 39.5% | +12.2 |
| 9 | Lithuania | 47.0% | 38.3% | −8.7 |
| 10 | Portugal | 29.5% | 38.0% | +8.5 |
| 11 | Finland | 28.4% | 37.8% | +9.4 |
| 12 | Malta | 17.6% | 36.6% | +19.0 |
| 13 | Austria | 29.3% | 36.2% | +6.9 |
| 14 | Luxembourg | 22.3% | 35.8% | +13.5 |
| 15 | Greece | 24.9% | 34.8% | +9.9 |
| 16 | Spain | 31.6% | 34.4% | +2.8 |
| 17 | Belgium | 31.8% | 34.2% | +2.4 |
| 18 | Romania | 33.2% | 33.9% | +0.7 |
| 19 | Slovenia | 29.2% | 33.7% | +4.5 |
| 20 | Slovakia | 31.2% | 32.6% | +1.4 |
| 21 | Netherlands | 25.3% | 30.1% | +4.8 |
| 22 | Germany | 27.3% | 29.1% | +1.8 |
| 23 | Czechia | 26.1% | 28.6% | +2.5 |
| 24 | Denmark | 21.4% | 28.2% | +6.8 |
| 25 | Italy | 20.2% | 27.9% | +7.7 |
| 26 | Croatia | 27.1% | 27.6% | +0.5 |
| 27 | Cyprus | 17.9% | 25.3% | +7.4 |
Source: Eurostat

In 2024, women make up 35.2% of managers across the European Union. It went up from a 29.7% share in 2002. That is a gain of 5.5 percentage points over two decades.
The managerial workforce remains predominantly male, but there is a steady growth of female managers that varies widely across Europe.
In 2024, the highest female representation is found in:
- Sweden – 44.4%
- Latvia – 43.4%
- Poland – 41.8%
At the lower end:
- Cyprus – 25.3%
- Croatia – 27.6%
- Italy – 27.9%
Most other countries cluster between 30% and 40% share of women in managerial positions.
This pattern does not follow a simple regional divide. The structure of each labour market matters more than geography.
In Sweden (44.4%), nearly half of managers are women. The public sector is large, especially in education and healthcare. Promotion systems are formal. Female labour participation has been high for decades. Together, these factors have created a steady pipeline of women moving into leadership roles over time.
Latvia (43.4%) reflects a different labour market structure. Female employment rates have long been high, including in professional occupations. The Baltic labour model places women strongly in education, public administration, and skilled services. This supports a relatively balanced managerial class.
Poland (41.8%) combines historical and economic factors. Female employment remained relatively strong after the socialist period. After EU accession, economic expansion created new managerial positions. Rising tertiary education among women reinforced this shift.
At the lower end, the constraints look different.
In Italy (27.9%) and Croatia (27.6%), overall female labour participation remains lower than in Northern and Baltic countries. Career interruptions and regional labour market differences affect progression into management.
In Germany (29.1%), part-time employment among women is widespread, especially after childbirth. Large industrial firms and private-sector hierarchies remain male-heavy at senior levels. The result is a slower change in managerial representation.
Women in Managerial Roles in Germany ->
The strongest increases since 2002 occurred in:
- Malta: +19.0 percentage points
- Sweden: +13.7
- Luxembourg: +13.5
- Ireland: +12.2
- Poland: +10.7
In smaller labour markets such as Malta and Luxembourg, percentage shifts can appear larger because the managerial base is limited. In larger economies (e.g., Poland), change tends to be more gradual. It reflects steady female workforce participation, service-sector growth over industry, and generational turnover as more female graduates of higher education enter mid-management.
Across Europe, the managerial class is evolving gradually. Women now make up just over one-third of managers in the EU. No country has reached parity, and most remain within the 30–40% range.
The shift is structural rather than sudden. It is shaped more by long-term labour market dynamics than by short-term policy changes.
More topics
- Women Hold Less Than A Third of Managerial Roles in Germany
- Top 10 Biggest EU Companies Led by Women
- Top 10 Richest Women in the EU
- Germany’s Median Wage by Federal State
- Employment by Federal State in Germany
- Gender Pay Gap Across EU Countries
- Germans Earn More Than Foreign Workers Across Germany
- Top German Companies by Revenue
- Top Companies in Germany by LinkedIn (2021-2025)
- Unemployment Across Germany: A Federal State Breakdown
- Germany’s Fastest-Growing Jobs by LinkedIn
- Which Federal States Drive Germany’s Economy?
- Highest Paying Jobs in Germany
- How Marriage Rates Have Fallen in Germany: 1990–2023
- How Germany’s Birth Rates Dropped and Deaths Rose