Key Takeaways
- Obesity is a major public health challenge in the EU. In 2022, 14.6% of people aged 16 and over in the EU were classified as obese.
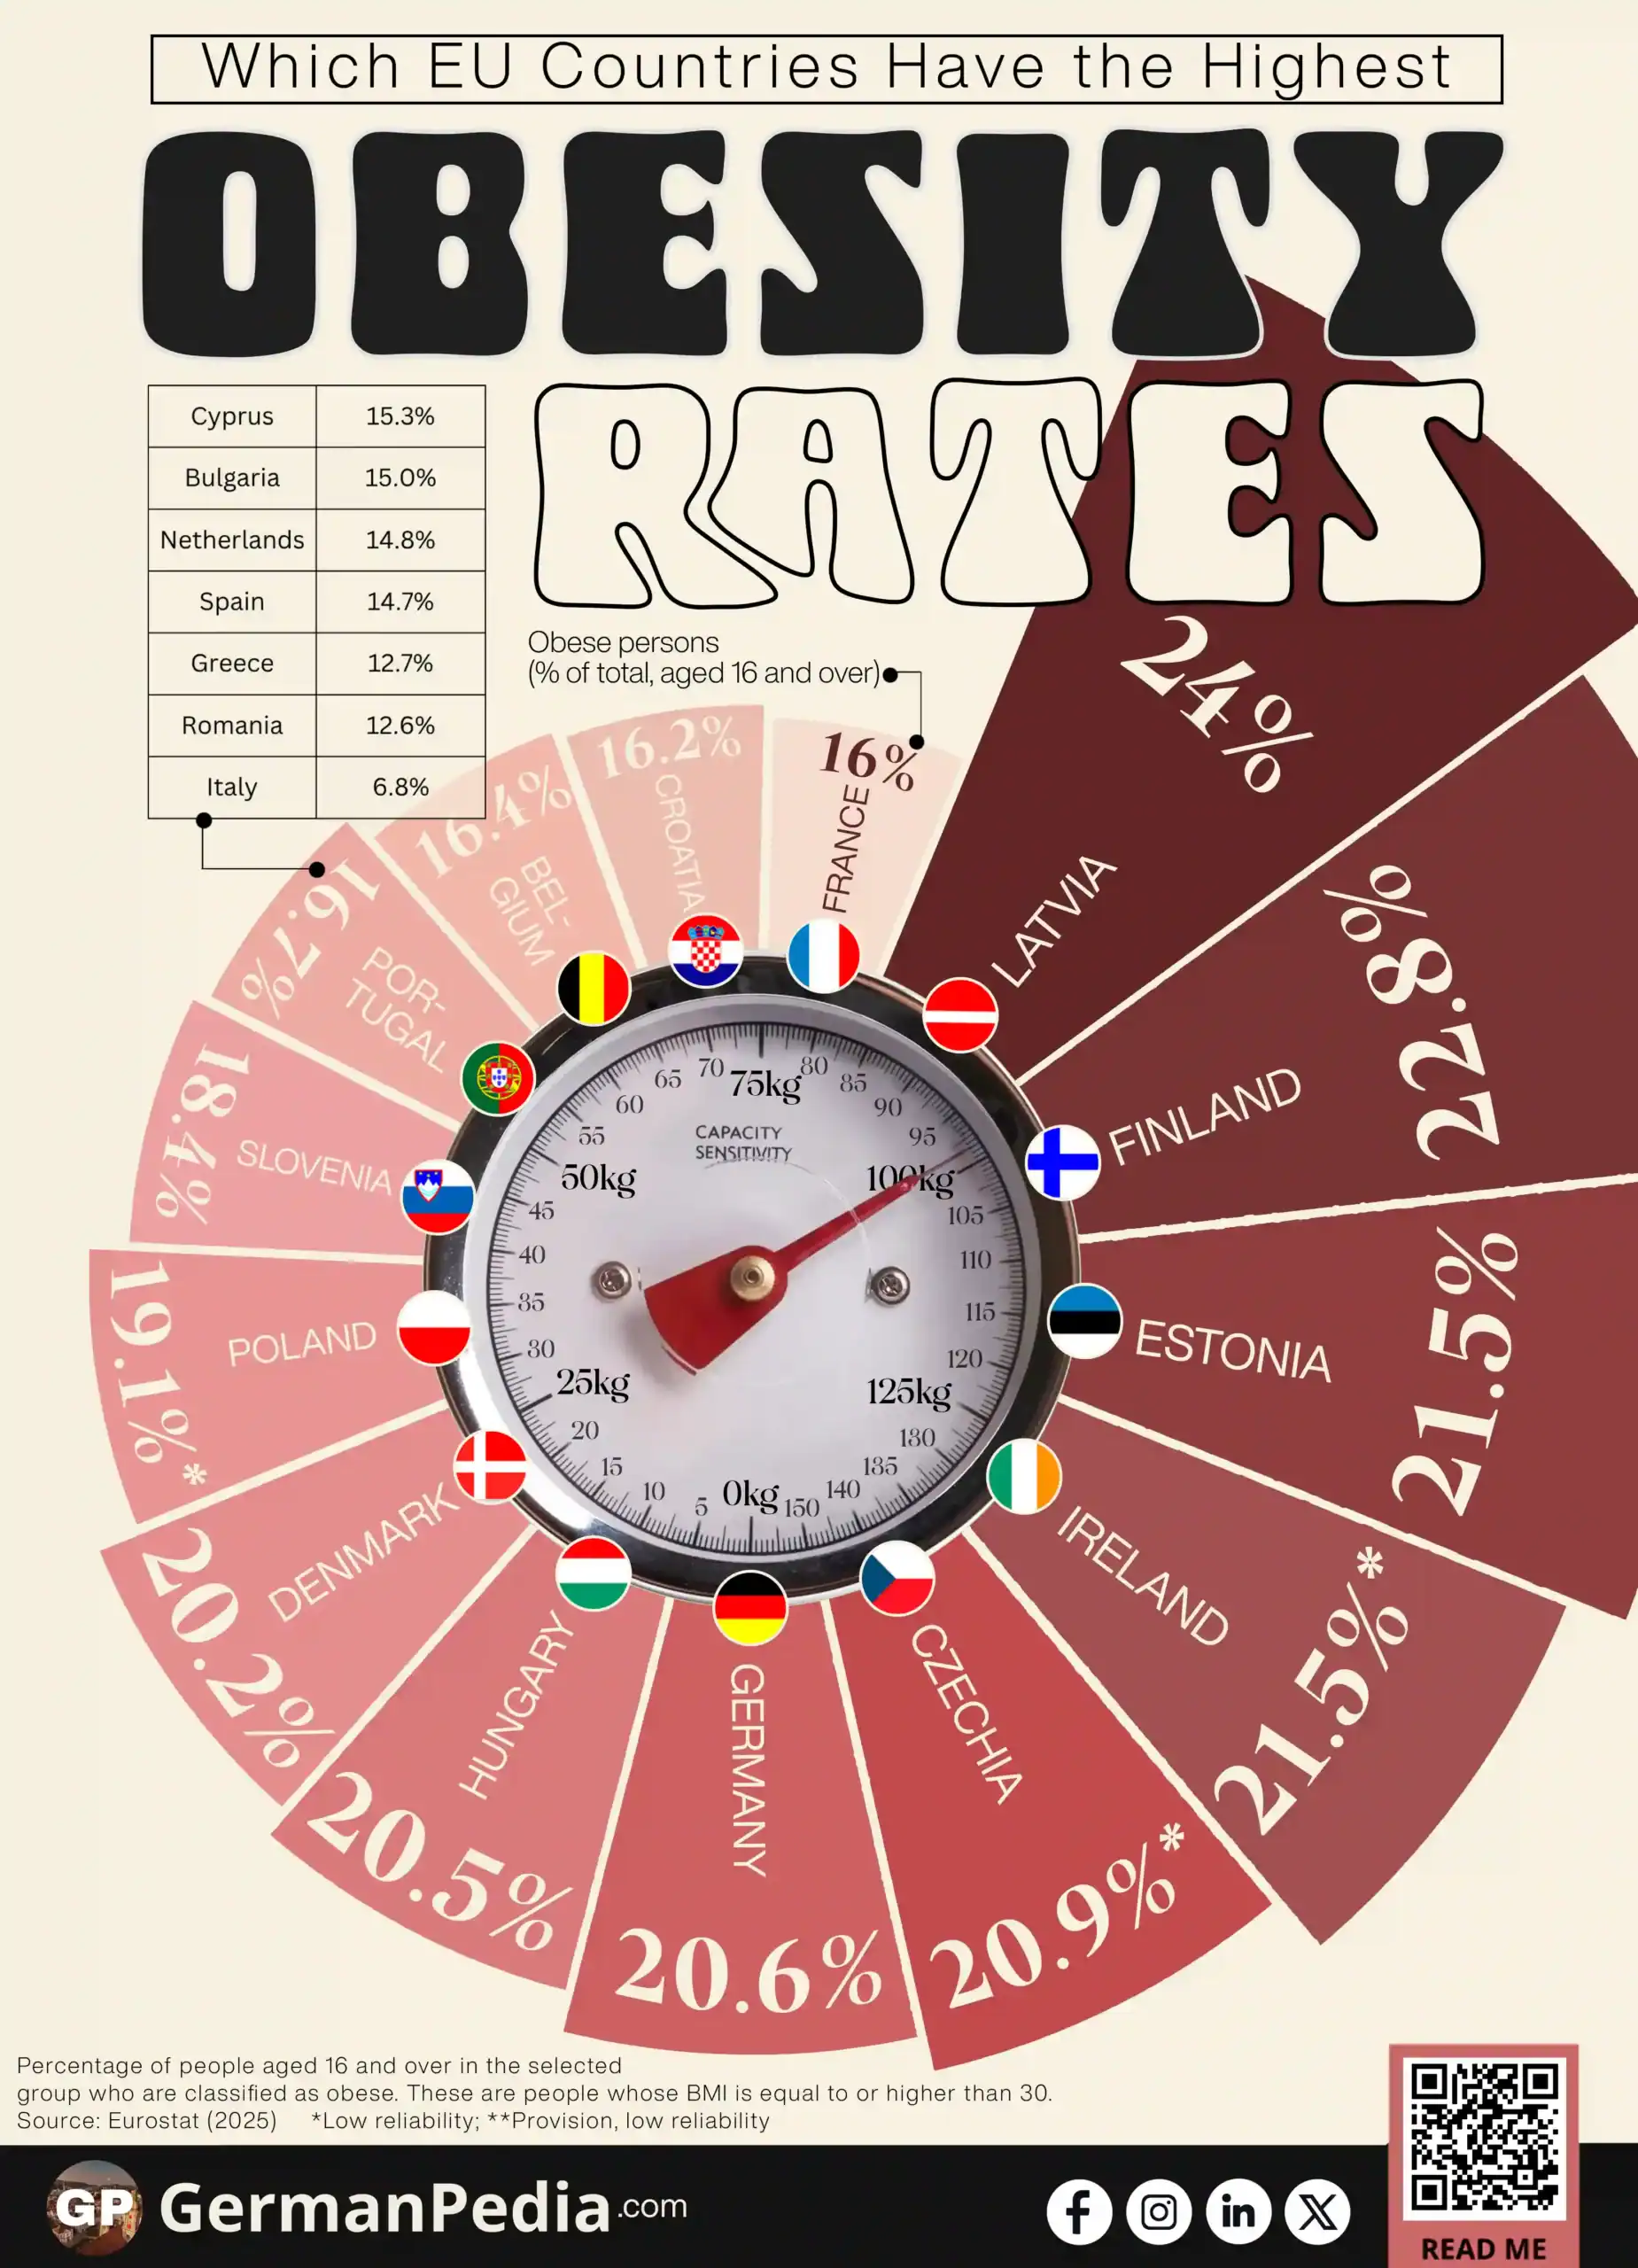
- The highest obesity rates are observed in countries such as Latvia (24.0%), Finland (22.8%), and Estonia (21.5%). These higher rates are often associated with patterns such as more calorie-dense diets, lower physical activity, and broader lifestyle changes.
- Italy stands out with the lowest obesity rate in 2025, which is often linked to its Mediterranean diet patterns.
- Obesity prevalence in the EU reflects a combination of diet, physical activity, and environmental conditions, rather than a single cause.
Use this Visualization: You may use this image for free with proper attribution to GermanPedia (i.e., by linking back to GermanPedia).
Need help communicating complex ideas visually? We help you turn data into your most persuasive story. Contact us to learn more.
Obesity Rates by EU Country
| Country | Obese persons (% of total, aged 16 and over) |
|---|---|
| Latvia | 24.0 |
| Finland | 22.8 |
| Estonia | 21.5 |
| Ireland | 21.5* |
| Lithuania | 21.2** |
| Czechia | 20.9* |
| Germany | 20.6 |
| Hungary | 20.5 |
| Denmark | 20.2 |
| Poland | 19.1* |
| Slovenia | 18.4 |
| Portugal | 16.7 |
| Belgium | 16.4 |
| Croatia | 16.2 |
| France | 16.0 |
| Cyprus | 15.3 |
| Bulgaria | 15.0 |
| Netherlands | 14.8 |
| Spain | 14.7 |
| Greece | 12.7 |
| Romania | 12.6 |
| Italy | 6.8 |
Source: Eurostat (2025)
*Low reliability; **Provision, low reliability

Obesity has become a major public health challenge across the European Union. In 2022, 14.6% of people aged 16 and over were classified as obese.
Obesity in the EU is driven not only by individual behavior, but also by “obesogenic environments” that make unhealthy food easier to access and physical activity harder to sustain. These conditions vary across EU countries and help explain differences in obesity rates.
The highest rates are found in countries such as Latvia (24.0%), Finland (22.8%), and Estonia (21.5%).
These higher obesity rates are often linked to factors such as:
- More processed and calorie-dense diets, which can contribute to overweight and obesity because they increase energy intake.
- Lower physical activity and more sedentary lifestyles
- Rapid lifestyle and diet changes, especially in parts of Eastern Europe, where Western consumption patterns have spread quickly.
By contrast, Italy stands out with the lowest obesity rate at 6.8%.
This lower prevalence is often associated with Mediterranean diet patterns, including higher consumption of vegetables, legumes, fruit, and fish. Traditional Italian eating habits are also often more structured around regular meals, with less frequent snacking than in some other countries.
Overall, obesity prevalence in the EU reflects a combination of diet, physical activity, and environmental factors, rather than a single cause. The variation across countries shows how different living conditions shape the share of people living with obesity.
More topics
- EU Countries Are Only Partly Self-Sufficient in Food
- 49% of Young Adults Live With Their Parents in the EU
- Grocery Prices in Germany [2000 – 2025]
- Changes in Harvest of Germany’s Five Key Crops
- EU Wage Growth In The Last Two Decades
- GDP per Capita vs Actual Consumption per Capita in the EU
- Where are Billionaires Concentrated in the EU?
- Happiness vs Income in the EU
- Most Surveilled Major Cities in the EU
- Electric and Hybrid Cars in the EU: Who Is Leading the Shift?
- Top 13 Most Valuable Brands in the EU
- EU Unicorn Startups: Which Countries Lead and Why
- EU Alternatives to Common US Platforms
- Public School Primary Teacher Salaries in the EU
- Where are Data Centers Concentrated in the EU?
References
- https://ec.europa.eu/eurostat/databrowser/view/ilc_hch10/default/table?lang=en
- https://ec.europa.eu/eurostat/statistics-explained/index.php?title=Overweight_and_obesity_-_BMI_statistics
- https://pmc.ncbi.nlm.nih.gov/articles/PMC2206294/
- https://www.eufic.org/en/healthy-living/article/europes-obesity-statistics-figures-trends-rates-by-country
- https://www.bbc.co.uk/food/articles/european_countries_lower_obesity_rates
- https://easo.org/members/obesity-in-italy/
- https://bresca.es/en/que-se-come-en-italia-en-cada-momento-del-dia/